Figure 1.
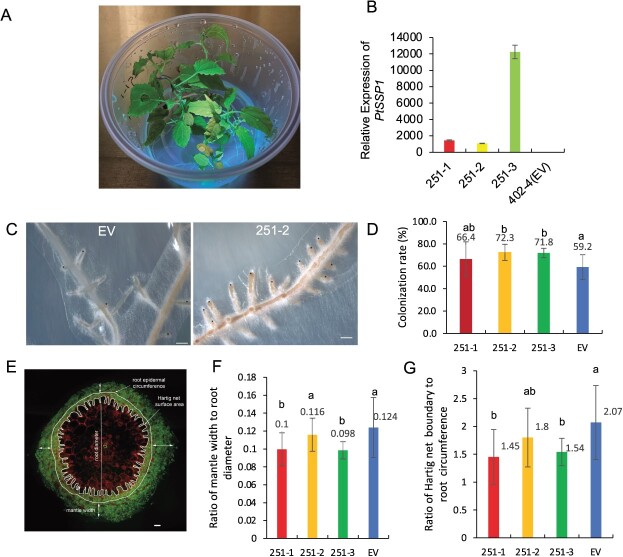
Impact of PtSSP1-overexpression on ectomycorrhiza (ECM) development with Laccaria bicolor and root development (A) Visualization of transgenic poplar plants under UV light. (B) Relative expression level of PtSSP1 in three transgenic lines and one empty vector control line. EV indicates empty vector. Error bars indicate SD. Sample size is 3. (C) Representative stereomicroscope images of the empty vector control (EV) and PtSSP1 overexpression (OE) plant (251–2) roots co-cultured with L. bicolor for three weeks. Black asterisks indicate the ECM root tips. Scale bar = 0.2 mm. (D) Percentage of ECM root tip formation in the PtSSP1 OE lines and EV control plants. Error bars represent the standard deviation (SD). n = 5–9. The data were statistically analyzed by t-test to assign the significance groups a and b (P <0.05). (E) Representative transverse cross sections of Populus roots co-cultured with L. bicolor for 3 weeks. Four different measurements, including mantle width, root diameter, Hartig net boundary, and root circumference as labeled in the picture, were acquired for each image using ImageJ. Scale bar = 20 μm. (F) Mantle width to root diameter ratio as a proxy for external fungal growth. Error bars indicate SD. n = 10–18 per line. The data were statistically analyzed by t-test to assign the significance groups a and b (P <0.05). (G) Hartig net boundary to root circumference ratio as a proxy for in planta fungal growth. Error bars indicate SD. n = 10–18 per line. The data were statistically analyzed by t-test to assign the significance groups a and b (P <0.05). (H) Number of root tips. Error bars indicate SD. n = 3–5. The data were statistically analyzed by one-way ANOVA with Tukey pairwise comparison to assign significance groups a and b (P < 0.05). (I) Total root length. Error bars indicate SD. n = 3–5. The data were statistically analyzed by one-way ANOVA with Tukey pairwise comparison to assign significance groups a and b (P < 0.05). (J) Root volume. Error bars indicate SD. n = 3–5. The data were statistically analyzed by one-way ANOVA with Tukey pairwise comparison to assign significance groups a and b (P < 0.05). (K) Root surface area. Error bars indicate SD. n = 3–5. The data were statistically analyzed by one-way ANOVA with Tukey pairwise comparison to assign significance groups a and b (P < 0.05). (L–N) PtSSP1 interacts with the LbGAL4-like protein in vitro and in plant cells. (L) Confirmation of the interaction of PtSSP1 with the LbGAL4-like protein using the Yeast-two-hybrid assay. Yeast harboring bait (BD) and prey (AD) plasmids were grown on synthetic complete medium (SC)-Leu (L)-Trp (W)-Ura (U) (left), and SC-Leu (L)-Trp (W) (right) agar media at 30°C for 3 days before cell growth was evaluated. The combination of Krve1/RalGDS-wt was used as a positive control, while the combination of Krve1/RalGDS-m2 was a negative control. (M) Bimolecular fluorescence complementation (BiFC) assay in infiltrated Nicotiana benthamiana leaves, indicating an in planta interaction between PtSSP1 and LbGAL4-like protein. Scale bar = 20 μm. The black triangle represents the N-terminal of LbGAL4-like protein. (N) Colocalization study in N. benthamiana cells showing PtSSP1-GFP and LbGAL4-like-RFP colocalized in the nucleus, as analyzed by confocal microscopy. Scale bar = 20 μm. Note: Significant groups are indicated by a and b (P < 0.05).

