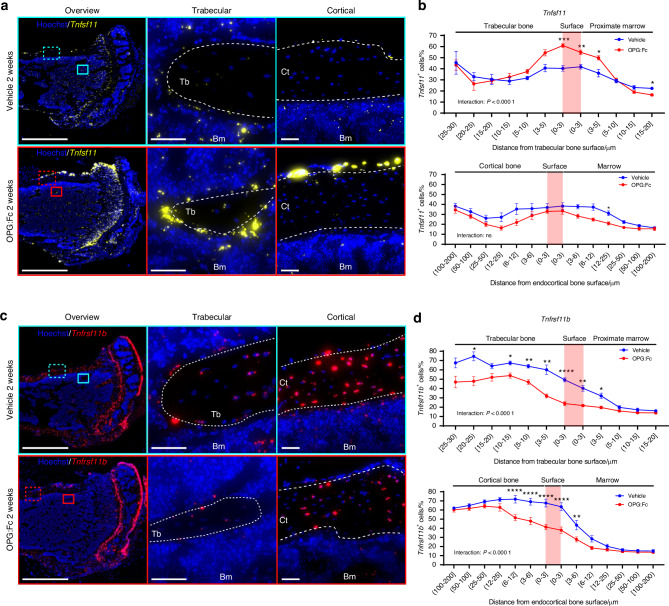
Fig. 2.
OPG:Fc treatment induces a changed Tnfsf11 and Tnfrsf11b expression pattern. Tibiae from 8-week-old female mice were harvested after being injected thrice weekly for two weeks with either vehicle or OPG:Fc (10 mg/kg). Following the final dose of OPG:Fc at the end of the two-week period, Tnfsf11 and Tnfrsf11b ISH was performed on tissue sections. a Tnfsf11 (yellow) illustrated in bone sections from vehicle and OPG:Fc-treated mice. b Percentage of Tnfsf11+ cells against the distance from the trabecular or endocortical bone surface. c Tnfrsf11b (red) illustrated in bone sections from vehicle and OPG:Fc-treated mice. d Percentage of Tnfrsf11b+ cells against the distance from the trabecular or endocortical bone surface. a, c White dashed lines highlight trabecular, endocortical, and periosteal bone surfaces. Data is expressed as mean ± SEM. P values are calculated using a two-way ANOVA. ****P values < 0.000 1, ***P values < 0.001, **P values < 0.01, *P values < 0.05. n = 8/group. Scale bars: (a, b) overview = 1 mm and high magnifications (a) = 100 µm, (b) = 50 µm. Ct cortical, Tb trabecular, Bm bone marrow, OPG:W OPG:Fc withdrawal

