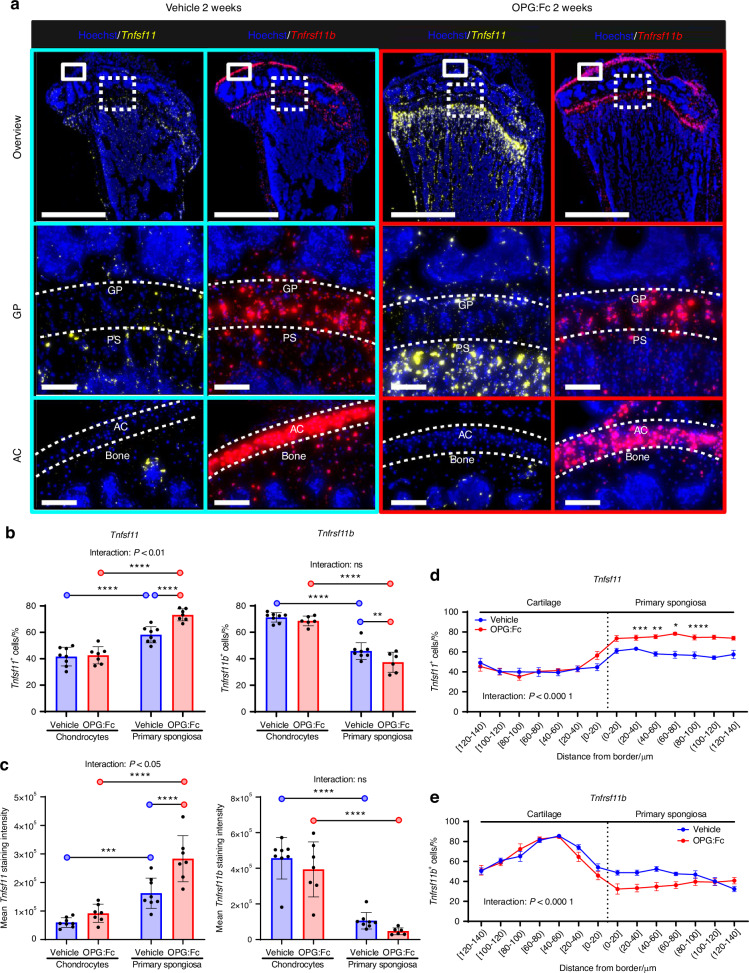
Fig. 4.
Chondrocytes of the epiphysial growth plate of the tibia express high levels of Tnfrsf11b, while cells residing in the primary spongiosa express high levels of Tnfsf11. All results on this figure are female mice treated with vehicle or OPG:Fc for two weeks. a ISH of Tnfrsf11b (red) present at high levels in the growth plate of the tibia and articular cartilage and Tnfsf11 (yellow), present at the primary spongiosa. b Percentage of Tnfsf11+ and Tnfrsf11b+ cells, and Tnfsf11+/Tnfrsf11b+ cell ratios in chondrocytes and cells within the primary spongiosa. c Mean staining intensities of Tnfsf11 and Tnfrsf11b, and Tnfsf11/Tnfrsf11b staining intensity ratios in chondrocytes and cells within the primary spongiosa. d, e Percentage of Tnfsf11+ and Tnfrsf11b+ cells against the distance from the border between the primary spongiosa and chondrocytes. b, c Data are shown as mean ± SD. d, e Data are shown as mean ± SEM. P values are calculated using a two-way ANOVA or a mixed-effects analysis. b–e ****P values < 0.000 1, ***P values < 0.001, **P values < 0.01, *P values < 0.05. n = 8/group. Scale bars: Overview = 1 mm, high magnification images = 100 µm. GP growth plate, AC articular cartilage, PS primary spongiosa

