Fig. 6.
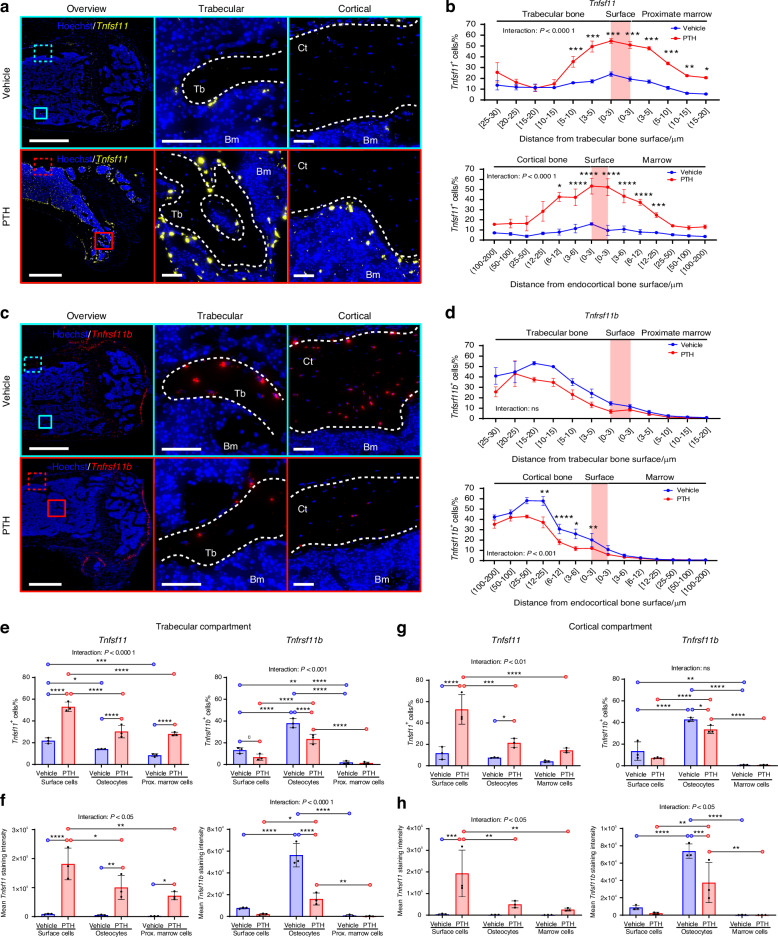
PTH treatment induces a changed Tnfsf11 and Tnfrsf11b expression pattern. Tnfsf11 and Tnfrsf11b ISH performed on sections of femora obtained from 12-week-old female mice, 1 h after they were injected with a single dose of PTH (80 µg/kg). a Tnfsf11 (yellow) ISH illustrated in sections of the femur from vehicle and PTH treated mice. b Percentage of Tnfsf11+ cells against the distance from the trabecular or endocortical bone surface. c Tnfrsf11b (red) ISH illustrated in bone sections from vehicle and PTH treated mice. d Percentage of Tnfrsf11b+ cells against the distance from the trabecular or endocortical bone surface. e Percentage of Tnfsf11+ and Tnfrsf11b+ trabecular surface cells, trabecular osteocytes, and proximate marrow cells. f Mean Tnfsf11 and Tnfrsf11b cell staining intensities in trabecular surface cells, trabecular osteocytes and proximate marrow cells. g Percentage of Tnfsf11+ and Tnfrsf11b+ endocortical surface cells, cortical osteocytes and marrow cells. h Mean Tnfsf11 and Tnfrsf11b cell staining intensities in endocortical surface cells, cortical osteocytes, and marrow cells. a–c White dashed lines highlight trabecular, endocortical, and periosteal bone surfaces. In (b, d) data is expressed as mean ± SEM. In (e–h) data is expressed as mean ± SD. P values are calculated using a two-way ANOVA or mixed-effects analysis. ****P values < 0.000 1, ***P values < 0.001, **P values < 0.01, *P values < 0.05. n = 3/group. Scale bars: (a, b) Overview = 1 mm and high magnifications (a) = 100 µm or (b) = 50 µm. Ct cortical, Tb trabecular, Bm bone marrow

