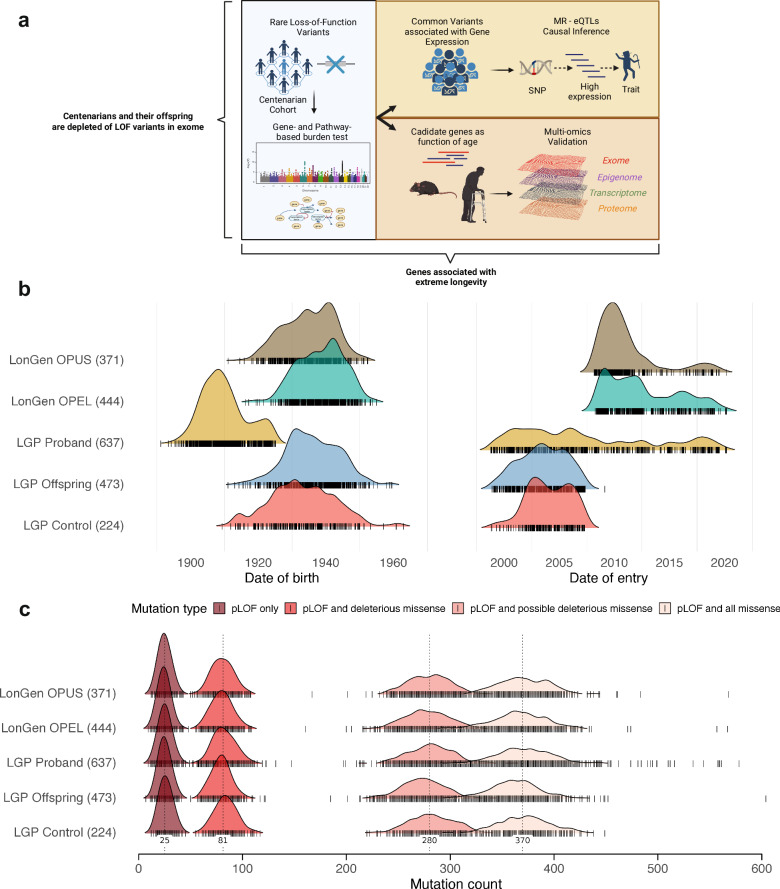
Fig. 1. Demographic characteristics and mutation burden of study cohorts.
a Schematic graph of the study design and analysis performed. Created in BioRender. Biosciences, R. (2022) BioRender.com/i68q986. b Date of birth and date of recruitment for centenarians, offspring, and controls from the Longevity Genes Project (LGP) and LonGenity study cohorts. Each vertical bar represents an individual, color-coded by their cohort status. c Distribution of the cumulative mutation burden across different categories of predicted deleterious variants in centenarians, offspring, and controls. The categories include pLOF only, pLOF and missense, pLOF and predicted deleterious missense (5/5 algorithms predict a deleterious variant), and pLOF and predicted deleterious missense (at least 1/5 algorithms predict a deleterious variant). Each dot represents an individual, with the violin plot showing the distribution of mutation counts within each category and cohort. OPEL: Offspring of Parents with Exceptional Longevity; OPUS: Offspring of Parents with Usual Survival. Source data are provided as a Source Data file.

