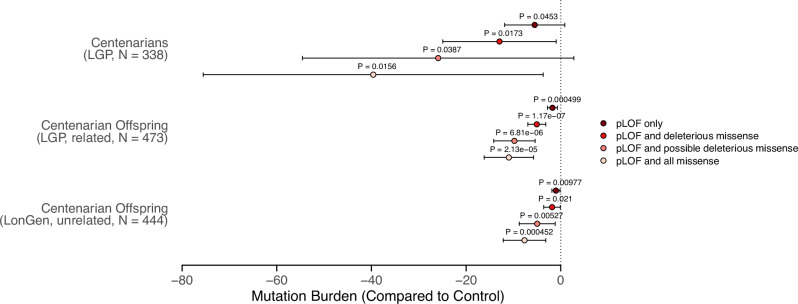
Fig. 2. Burden test results for different categories of predicted deleterious variants, adjusting for potential confounders.
The points show the effect sizes (beta coefficients) and the error bars show the 95% confidence intervals from the linear regression models, with the mutation burden as the dependent variable and the cohort status (centenarian or offspring, compared to control) as the independent variable. The models were adjusted for the binned date of recruitment and date of birth as covariates. The p-values for each comparison are shown on the right side of the plot. The categories of predicted deleterious variants include pLOF only, pLOF and missense, pLOF and predicted deleterious missense (5/5 algorithms predict a deleterious variant), and pLOF and predicted deleterious missense (at least 1/5 algorithms predict a deleterious variant). Source data are provided as a Source Data file.

