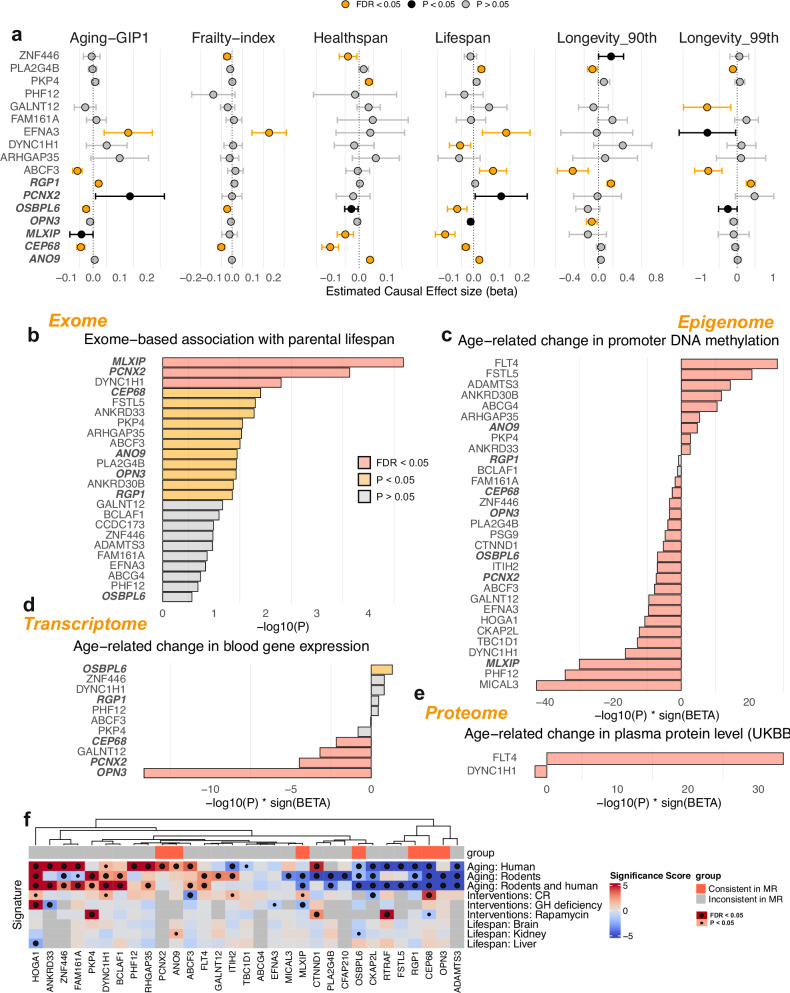
Fig. 4. Mendelian randomization and multi-omic analyzes of longevity-associated genes.
a Mendelian Randomization (MR) analyzes of blood gene expression on aging-related traits. The point shows the estimated causal effect sizes (beta) and the error bars show the 95% confidence intervals for each gene on various aging-related traits, including aging-GIP1, frailty index, healthspan, lifespan, and extreme longevity (90th and 99th percentiles). The forest plot is colored based on the significance and consistency of the causal effect estimates across different traits. Genes with FDR < 0.05 after being adjusted for multiple comparisons are colored in orange. Two-sided tests were performed. The blood eQTLs summary statistics are obtained from eQTLgen study (n = 31,684). b–e Bar plots showing the -log10(P-value) multiplied by the sign of the effect size (beta) for each longevity-associated gene. Associations with nominal P < 0.05 are colored in yellow, and those with FDR < 0.05 after being adjusted for multiple comparisons are colored in red. Two-sided tests were performed. Data sources include exome-wide association analysis with parental lifespan from GeneBass (b), age-related changes in promoter DNA methylation using data from 500 individuals in the MGB biobank (c), age-related changes in blood gene expression using data from the transcriptome-wide association study (TWAS) for aging by Peters et al. 2015 (d), and age-related changes in plasma protein levels using Olink data from 53,015 UK Biobank participants (e). Positive values indicate an increase, while negative values indicate a decrease with age. f Heatmap showing the significance scores of longevity-associated genes across different aging signatures, including human aging, rodent aging, and interventions (caloric restriction, rapamycin, and growth hormone deficiency). Color intensity represents the significance of the association, with red indicating a positive significance score and blue a negative significance score. Associations that reach nominal significance (P < 0.05) are marked with small circles, and those with FDR < 0.05 after being adjusted for multiple comparisons are marked with large circles. Two-sided tests were performed. Source data are provided as a Source Data file.

