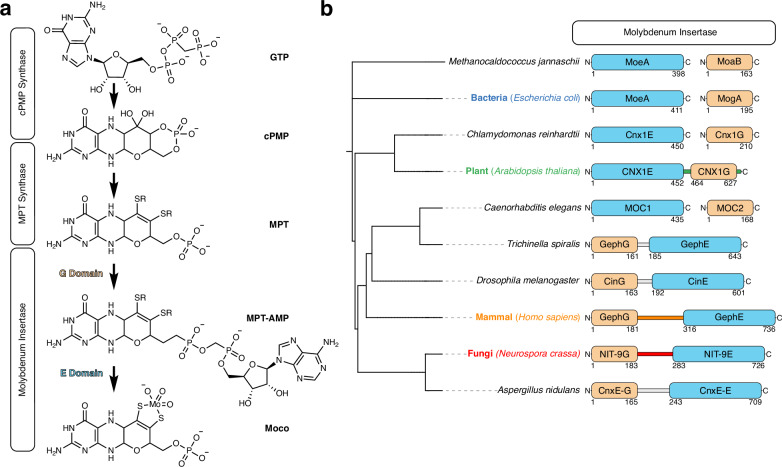
Fig. 1. Moco biosynthesis pathway and diversity of the Molybdenum insertase.
a Schematic representation of the Moco biosynthetic pathway with enzyme complexes depicted in boxes. Intermediates such as guanosine triphosphate (GTP), cyclic pyranopterin monophosphate (cPMP), molybdopterin (MPT), molybdopterin adenosine monophosphate (MPT-AMP), and molybdenum cofactor (Moco) structures are illustrated. b Phylogenetic tree derived from the NCBI taxonomy database showing selected species for further analysis of the orientation and sequence of the linkage region. Species involved in the analysis are color-coded (Blue: Bacteria; Green: Plant; Orange: Mammal; Red: Fungi). The schematic representation of the Molybdenum insertase protein includes the G domain in beige and the E domain in sky blue, with the linkage region colored according to species. Non-cloned sequences are depicted in gray. Boarders are numbered according to the G or E domain’s start and end residue.

