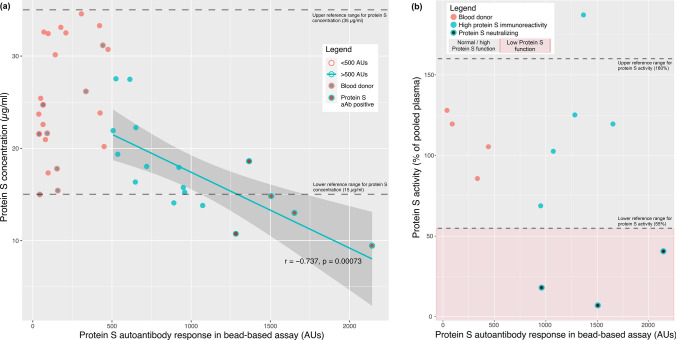
Fig. 2.
Confirmatory testing results for protein S autoantibodies. Scatterplot (a) shows protein S concentration and autoantibody response in different subgroups as stratified by the legend as well as the correlation curve for subjects with > 500 AU response to protein S in the bead-based assay. Correlation coefficient (Pearson r) and p value refers to all subjects with response exceeding 500 AUs. Protein S activity results in relation with protein S concentrations (b) reveals three patients with reduced protein S activity (< 55% of pooled plasma) and one patient with increased activity. Note: one patient with protein S autoantibody positivity did not undergo confirmatory analyses due to unavailability of sample. Abbreviations: AU: arbitrary unit, aAb: autoantibody.

