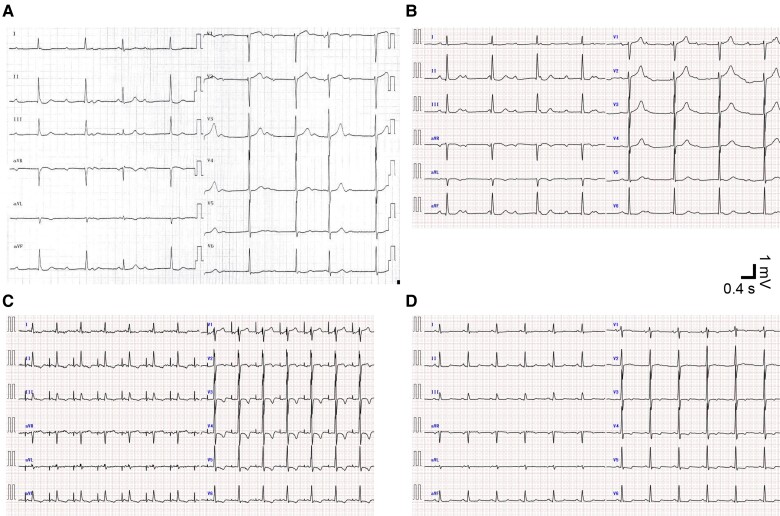
Figure 1.
Time series of electrocardiograms. Vertical and horizontal bars denote 1 mV and 0.4 s, respectively. (A) Twelve-lead electrocardiogram of complete atrioventricular block 3 months before the present visit shows electrical atrioventricular dissociation. (B) Twelve-lead electrocardiogram of complete atrioventricular block at the present visit. (C) Twelve-lead electrocardiogram immediately after surgical aortic valve replacement shows spontaneous R waves following temporary atrial pacing. Atrial pacing spike to R-wave duration is 190 ms. (D) Twelve-lead electrocardiogram on post-operative Day 7 shows regular sinus rhythm with a PR interval of 154 ms.

