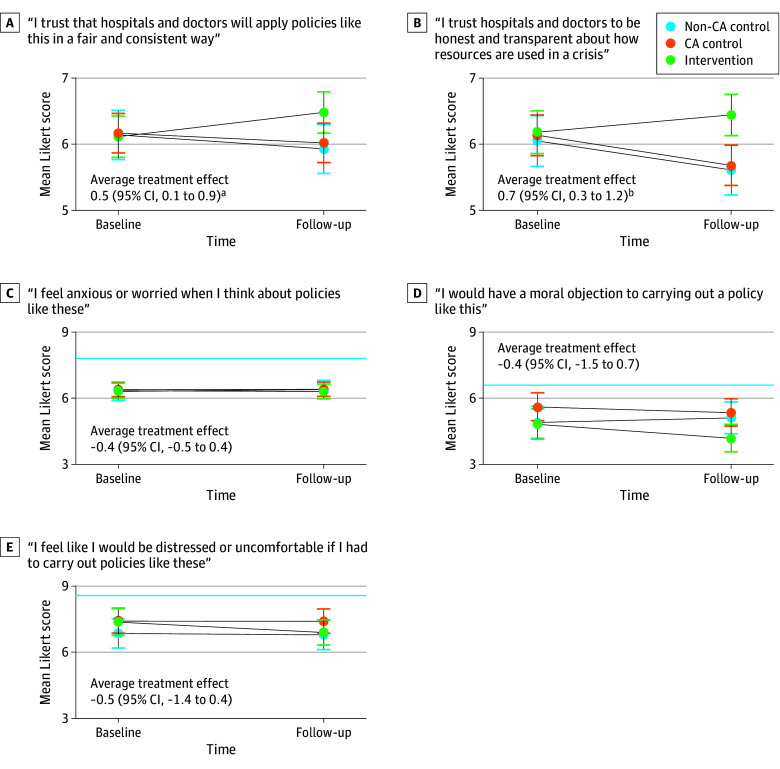
Figure 3. Marginal Estimates of Change in Trust and Anxiety Items by Point and Randomization Group.
The solid blue line indicates noninferiority threshold when appropriate. Indicators denote point estimates of group means with 95% CIs. Difference in differences between intervention and control (average treatment effect) with CIs are shown. A score of 1 indicates strongly disagree; a score of 10 indicates strongly agree.
aP < .05.
bP < .01.

