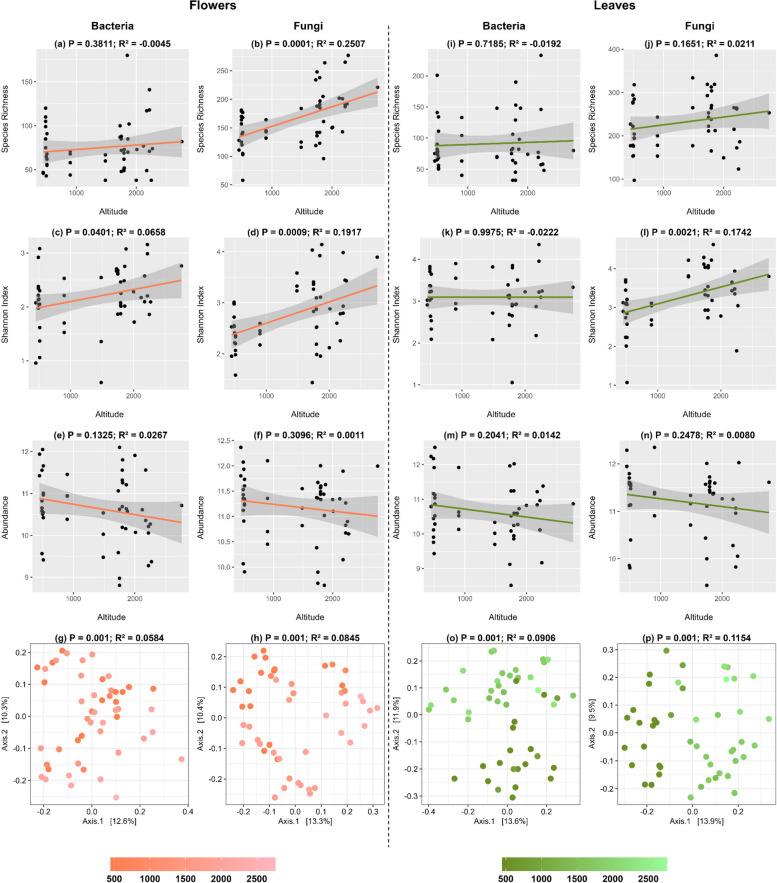
Fig. 5.
Bacterial and Fungal linear regressions and PCoA plots in flowers and leaves at different altitudes. Species richness (a, b, i, j), shannon index (c, d, k, l), and abundance (e, f, m, n) were all modelled separately using a linear regression with the function 'lm' (stats package) with statistical relevant values being extracted from the linear regression. PCoA plots (g, h, o, p) illustrate the bacterial and fungal community composition. Panels are organized to highlight the corresponding metrics for flowers and leaves communities in the specified compartments

