FIGURE 8.

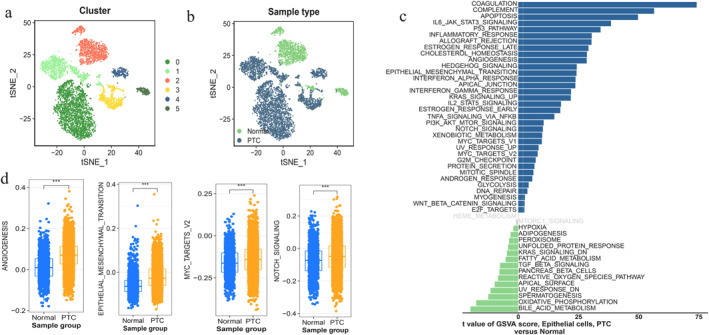
Epithelial cell cluster. (a–b) t‐SNE plot of 6167 epithelial cells, colour‐coded by their associated cluster or sample type. (c) Differences in pathway activities scored per cell by Gene set variation analysis (GSVA) analysis between normal (non‐PTC) and PTC epithelial cells. T‐values from a linear model are shown. (d) Boxplots show activity scores for 5 selected signalling pathways, stratified by normal (non‐PTC) or PTC epithelial clusters (blue and orange). PTC: papillary thyroid carcinoma; and GSVA: Gene set variation analysis.
