FIGURE 1.

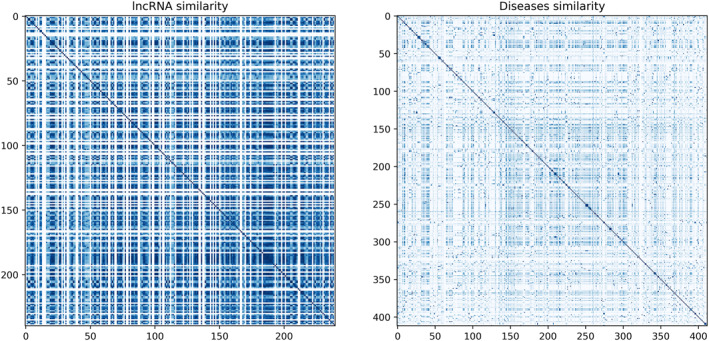
Heatmaps illustrating lncRNAs and diseases similarity matrices. The colour intensity represents the degree of similarity, with darker shades indicating higher similarity values and vice versa.

Heatmaps illustrating lncRNAs and diseases similarity matrices. The colour intensity represents the degree of similarity, with darker shades indicating higher similarity values and vice versa.