FIGURE 2.

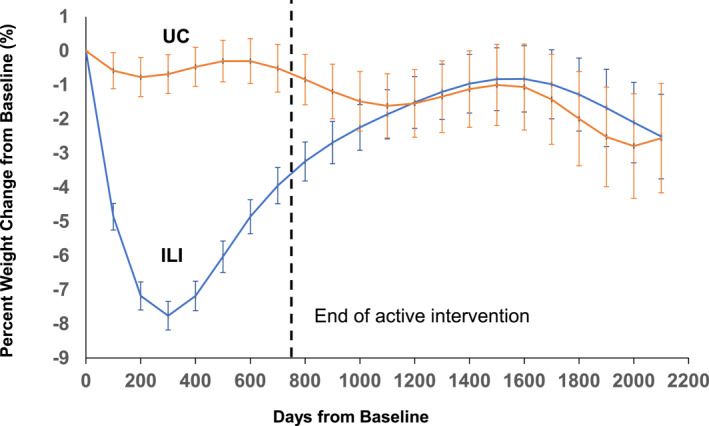
Percent weight loss from baseline in the Intensive Lifestyle Intervention and Usual Care groups. Error bars represent standard errors. The vertical dotted line indicates the end of the active study phase; *p < 0.05 between groups.

Percent weight loss from baseline in the Intensive Lifestyle Intervention and Usual Care groups. Error bars represent standard errors. The vertical dotted line indicates the end of the active study phase; *p < 0.05 between groups.