
FIGURE 2.
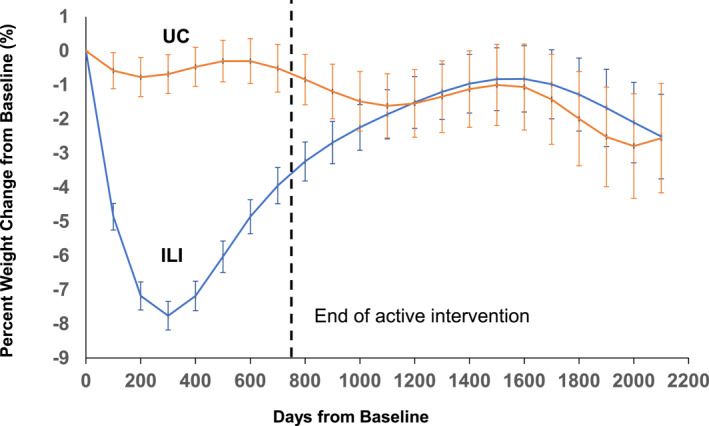
Percent weight loss from baseline in the Intensive Lifestyle Intervention and Usual Care groups. Error bars represent standard errors. The vertical dotted line indicates the end of the active study phase; *p < 0.05 between groups.
Official websites use .gov
A
.gov website belongs to an official
government organization in the United States.
Secure .gov websites use HTTPS
A lock (
) or https:// means you've safely
connected to the .gov website. Share sensitive
information only on official, secure websites.
Percent weight loss from baseline in the Intensive Lifestyle Intervention and Usual Care groups. Error bars represent standard errors. The vertical dotted line indicates the end of the active study phase; *p < 0.05 between groups.