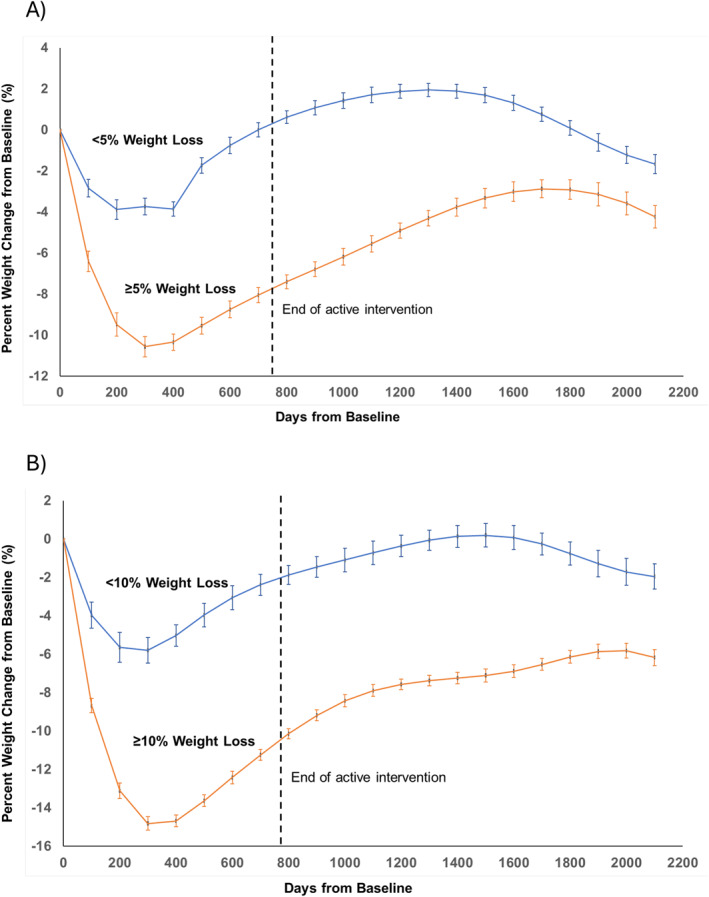
FIGURE 3.

Percentage weight loss in the Intensive Lifestyle Intervention group among those who lost (A) ≥5% body weight and (B) ≥10% body weight between baseline and 12 months versus those who did not. Error bars represent standard errors. The vertical dotted line indicates the end of the active study phase; *p < 0.05 between groups.
