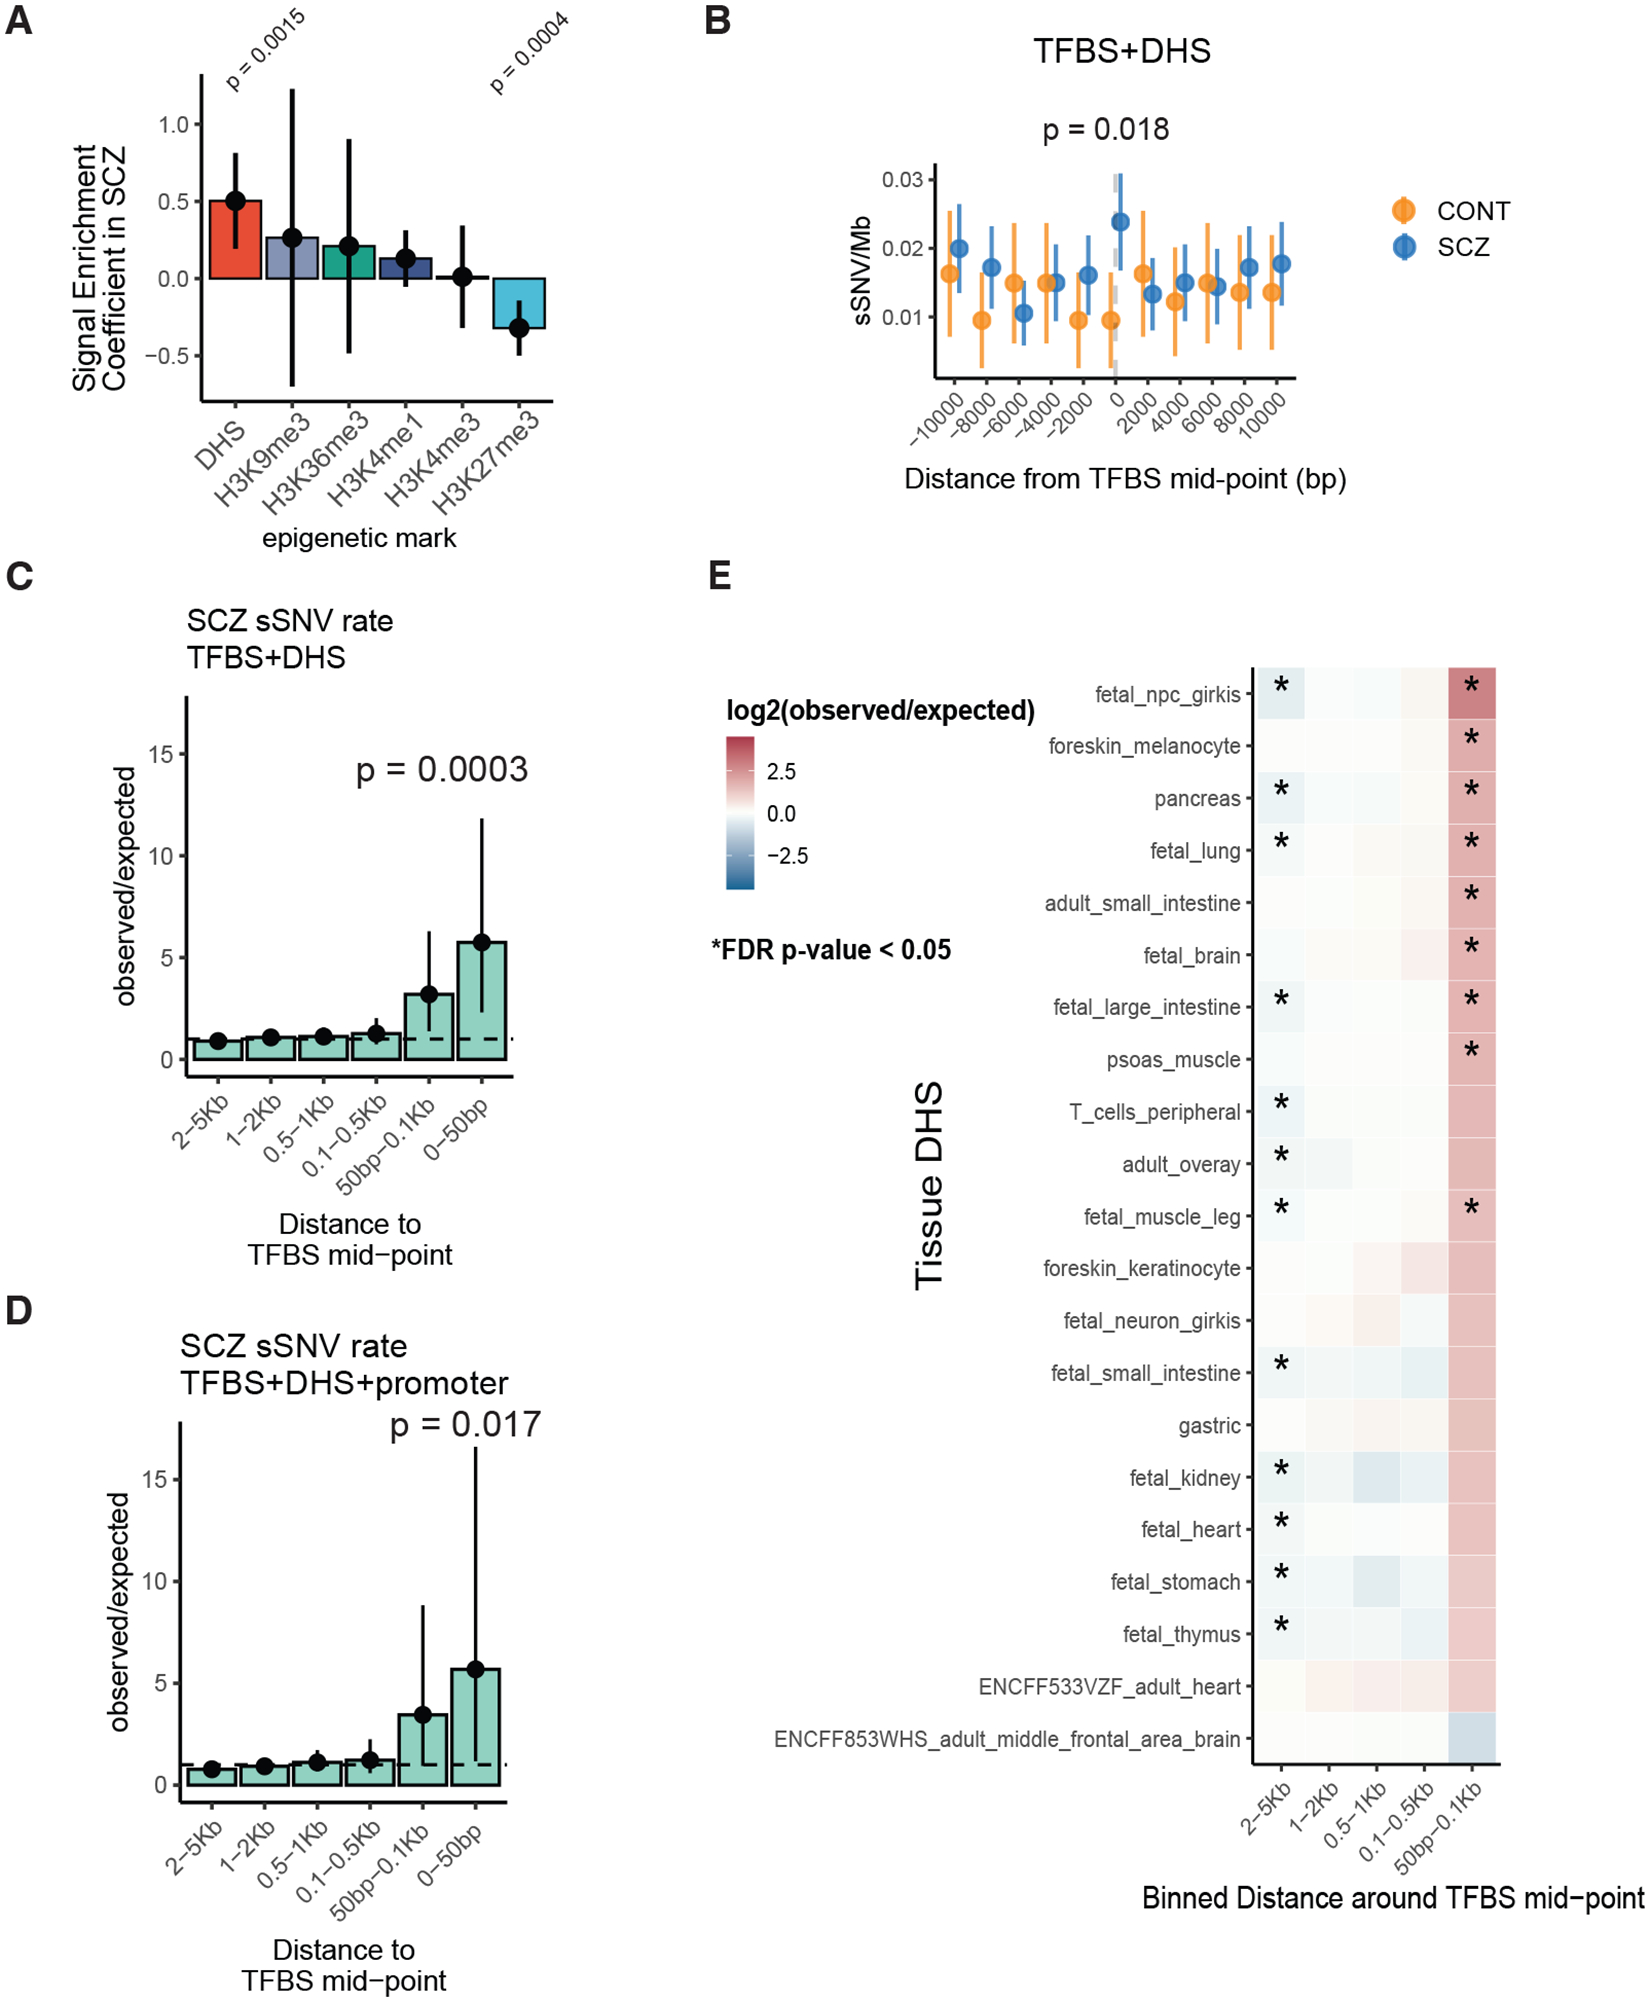
Fig. 2. Increased sSNV rate at developmentally active transcription factor binding sites (TFBS in SCZ.

A) Bar plot of binomial regression interaction term between epigenomic tracks and disease status. Positive values indicate enrichment in SCZ and negative values indicate depletion. Line ranges indicate 95% confidence intervals from binomial regression. B) Somatic SNV rate at +/− 10Kb region from active TFBS in fetal brain (TFBS+DHS) in SCZ and controls. C, D) Bar plot of observed over expected mutation rate at binned regions around TFBS in SCZ. E) Heatmap of rate ratios in SCZ at TFBS using different DHS tracks. For B, C, D, and E p-values and confidence intervals were calculated using Poisson tests. For E, stars indicate statistical significance at the FDR adjusted p < 0.05 level.
