Fig. 1.
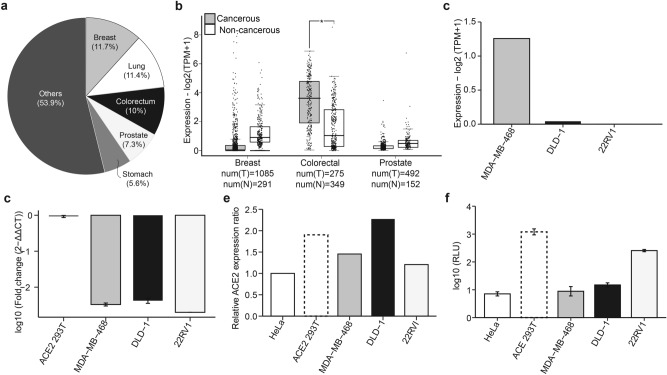
ACE2 expression and SARS-CoV-2 infection of various cancer cells. (a) Pie chart showing the proportion of various cancers globally. Data from GLOBOCAN (https://www.uicc.org/news/globocan-2020-new-global-cancer-data). (b) Box plots comparing the expression of ACE2 expression in tumor (grey) and corresponding normal (white) breast, colorectal, and prostate tissues. The expression cut-off was set at 1 from the log2 fold change (Log2FC) with a p-value cut of 0.01. Data are presented as a fold change of log expression of ACE2 transcripts per million (Log2TPM). The numbers of T = tumor and N = normal tissues are provided. The horizontal line across the box is the median expression while the whiskers depict a 1.5 × interquartile range. (c) Bar plot showing ACE2 expression in MDA-MB-468, DLD-1, and 22RV1 cell lines. The values were transformed to log2(TPM + 1). Data from DEPMAP (https://depmap.org/portal/interactive/). (d) Bar plots summarizing the mRNA expression of ACE2 transcripts across the three cell lines were determined using RT-qPCR. The data represent log-transformed fold changes for at least three independent experiments. Error bars depict the standard error of the mean (SEM). (e) Bar plot showing expression of ACE2 protein in the three cell lines measured using dot blot assay. Dot intensities were quantified with ImageJ/Fiji and expressed as the relative protein expression ratios of net band to net loading control. (f) Bar plots showing the infectivity of various cell lines with SARS-CoV-2 spike pseudovirus (sPV). The infectivity measurements were performed using luciferase assay on a GloMax luminescence plate reader. Infectivity was expressed as log10 relative light unit (RLU). Errors bars represent SEM. ACE2 293 T, a cell line stably expressing ACE2, and HeLa cells, known to lack ACE2, were used as controls.

