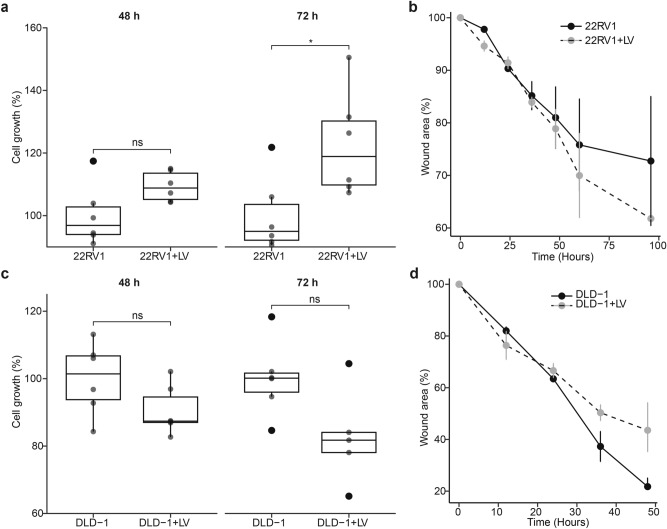
Fig. 3.
Effect of SARS-CoV-2 infection on prostate and colorectal cancer cell proliferation and migration. (a) Box plots showing the proliferation of 22RV1, a prostate cancer cell line infected with LV for 48 and 72 h. Data are expressed as the percentage cell growth calculated by (mean absorbance of test/mean absorbance of control) × 100. Box plots represent the median and upper and lower quartiles of the distribution whereas whiskers represent 1.5 times the interquartile range. (b) Line plots showing the changes in the wound area in LV infected and uninfected 22RV1 cells across different time points. Error bars represent the SEM. (c) Box plots showing the proliferation of DLD-1, a colorectal cancer cell line infected with LV for 48 and 72 h. Data are expressed as the percentage cell growth calculated by (mean absorbance of test/mean absorbance of control) × 100. Box plots represent the median and upper and lower quartiles of the distribution whereas whiskers represent 1.5 times the interquartile range. (d) Line plots showing the changes in the wound area in LV-infected and uninfected DLD-1 cells across different time points. Error bars represent the SEM.

