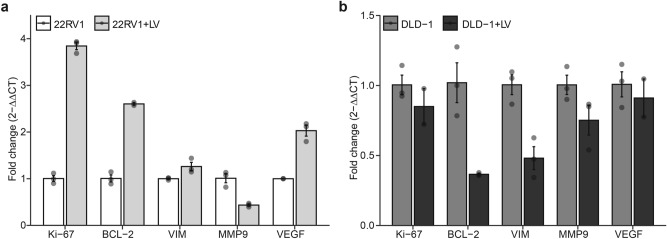
Fig. 4.
Effect of SARS-CoV-2 infection on the expression of various cancer markers in prostate and colorectal cancer cells. (a) Bar plots showing the relative expression of proliferative, apoptotic, migratory, and angiogenic markers in 22RV1 infected with LV. Data are expressed as the fold change calculated by 2-ΔΔCT. Error bars depict SEM. (b) Bar plots showing the relative expression of proliferative, apoptotic, migratory, and angiogenic markers in DLD-1 infected with LV. Data are expressed as the fold change calculated by 2-ΔΔCT. Error bars depict SEM.

