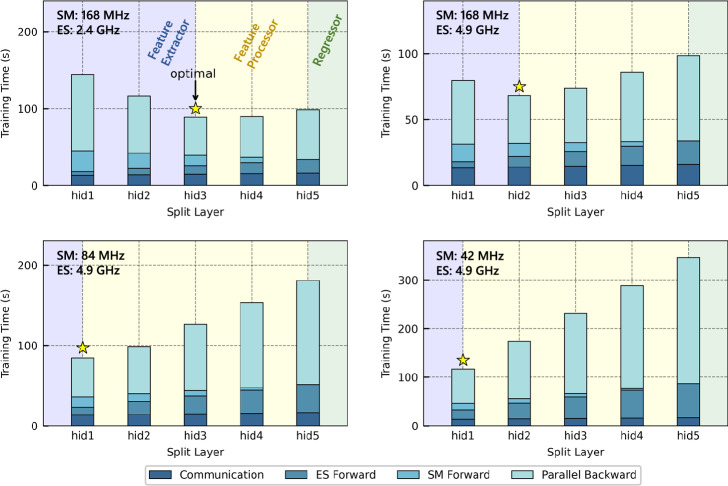
Fig. 4. Effectiveness of the efficiency-optimal model splitting strategy.
Each hidden layer is considered a candidate split layer. The split layers that yield the best efficiency are annotated. The hidden layers contained in the feature extractor, feature processor, and regressor after the optimal splitting are indicated with different colors. The total training times under four distinct hardware configurations when choosing different split layers are provided. The stacked histograms represent the measured times for communication, forward propagation of the edge server and smart meter, and parallel backward propagation, arranged from bottom to top. Source data are provided as a Source Data file.

