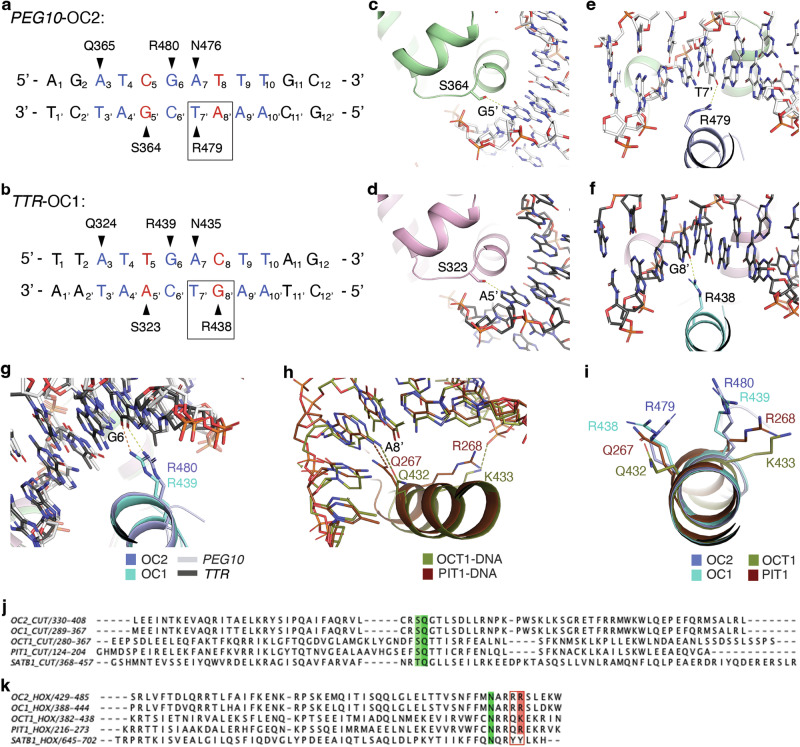
Fig. 2. The RR motif in the HOX domain of OC2 shows unique DNA interactions.
a, b PEG10 and TTR DNA sequences and corresponding conserved base-specific interactions with OC2 and OC1, respectively. The core sequence is shown in blue except the bases at which PEG10 and TTR vary, that are in red. Black triangles depict interaction sites; the respective base-interacting residues are indicated. The difference in interaction of the first arginine (OC2 R479 or OC1 R438) of RR pair is shown with a black rectangular outline. c–f Interaction of OC2 S364, equivalent OC1 S323, and OC2 R479 and equivalent OC1 R438, to DNA. Hydrogen bonds in panels (c–f) are shown as yellow dashed lines. g Interaction of OC2 R480 and equivalent OC1 R439 (yellow and orange dashed lines, respectively). h Interactions of the POU residues corresponding to the OC arginine pair [PDB 1E3O [10.2210/pdb1E3O/pdb] (OCT1) and 1AU7 [10.2210/pdb1AU7/pdb] (PIT1)]. Hydrogen bonds are shown in the same color as respective proteins. i The relative orientations of the OC arginine pair and corresponding OCT1 and PIT1 residues. j, k Structure-based sequence alignment of CUT (j) and HOX (k) domains of OC2, OC1, OCT1, PIT1 and SATB1. The amino acid ranges are indicated. The conserved serine (S364) in CUT is highlighted (in green) while the arginine pair (RR motif; R479/R480) in HOX are shown with a red border. The conserved glutamine (Q365) in CUT and asparagine (N476) in HOX are also highlighted (in green). The color of highlighted residues is based on Clustal scheme.

