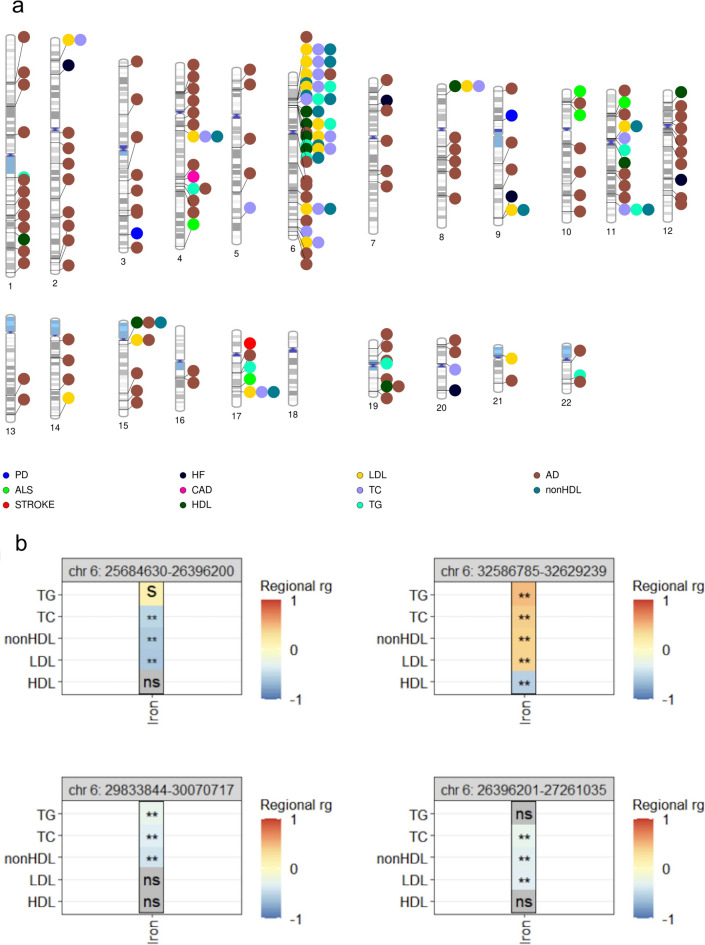
Fig. 2.
Local genetic correlations between iron and NDD or CVD. Chromosomal visualization (created using PhenoGram78) of significantly correlated regions between iron and the 11 neurodegenerative or cardiovascular traits tested as listed in Supplementary Table 1 (a). Illustration of selected significant shared regional correlations on chromosome 6 (either just upstream or within the major histocompatibility complex) between serum iron and lipid traits tested (b). **Significant local correlation after Bonferroni correction; s: p-value < 0.05 but not significant at the Bonferroni correction threshold; ns non-significant (p-value > 0.05), AD Alzheimer’s disease, PD Parkinson’s disease, ALS amyotrophic lateral sclerosis, CAD coronary artery disease, HF heart failure, TC total cholesterol, TG triglycerides, HDL high-density lipoprotein cholesterol, LDL low-density lipoprotein cholesterol, nonHDL non-high-density lipoprotein cholesterol.

