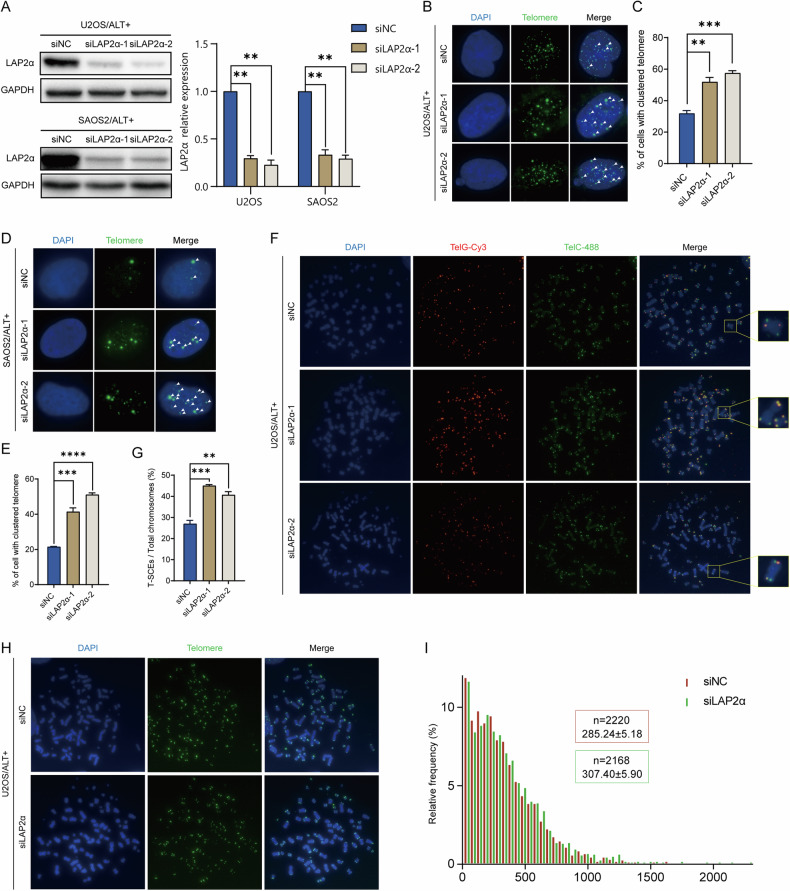
Fig. 2. Knockdown LAP2α elevates the telomeric homologous recombination and extends the telomere length of ALT cells.
A Left panel: LAP2α expression was measured by western blot after infecting with control or LAP2α siRNA in U2OS and SAOS2 cells. Right panel: Quantification of the LAP2α relative protein level in comparison to GAPDH and to siNC was calculated by ImageJ software. Error bars represent the mean ± SEM of four independent experiments. Two-tailed unpaired Student’s t-test was used to calculate p-values. **p < 0.01. B Representative images showing telomere clustering of U2OS cells in the presence of control or LAP2α siRNA. C Quantification of (B), the percentage of cells containing clustered telomeres. Error bars represent the mean ± SEM of three independent experiments. Two-tailed unpaired Student’s t-test was used to calculate p-values. **p < 0.01; ***p < 0.001. D Representative images showing telomere clustering of SAOS2 cells. E Quantification of (D). Error bars represent the mean ± SEM of three independent experiments. Two-tailed unpaired Student’s t-test was used to calculate p-values. ***p < 0.001;****p < 0.0001. F Telomeric DNA CO-FISH on metaphases from U2OS cells to reveal T-SCEs. Cells were harvested 3 days after siRNA transfection. G Quantification of the average number of T-SCEs per chromosome detected in U2OS cells. Error bars represent the mean ± SEM of three independent experiments. Two-tailed unpaired Student’s t-test was used to calculate p-values. **p < 0.01; ***p < 0.001. H Q-FISH analysis of relative telomere length in U2OS cells. Representative images showing telomeres hybridized with PNA Alexa 488-labeled telomere probe (green). I Frequency distributions of relative telomere length telomere length of (H).

