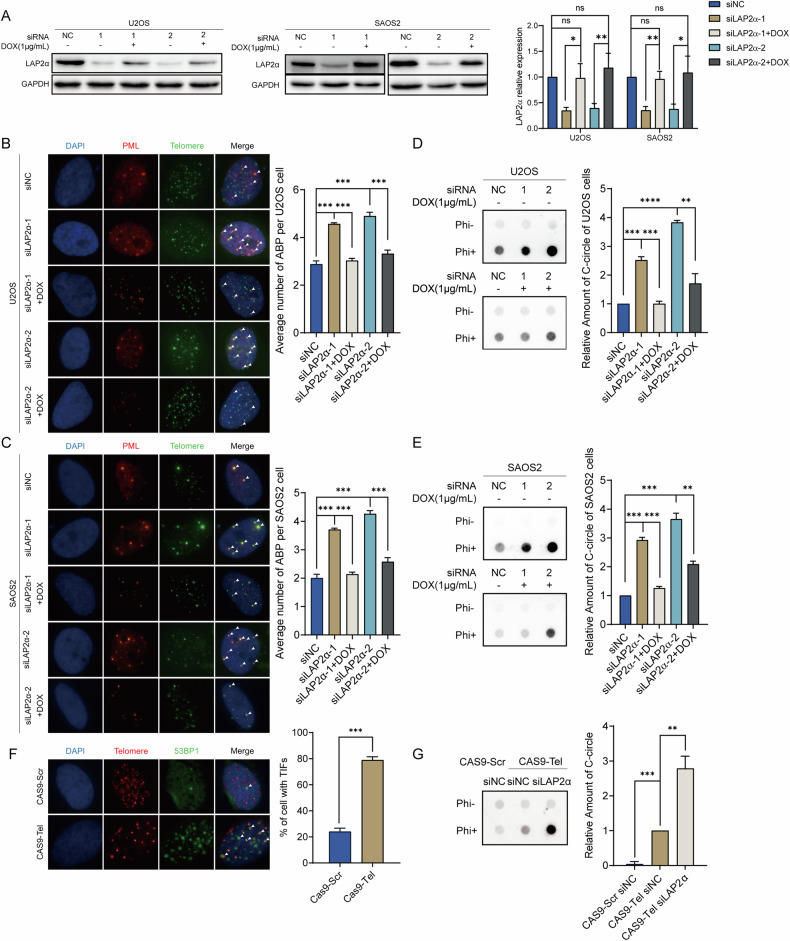
Fig. 3. LAP2α depletion stimulates the formation of hallmarks of ALT.
A Left panel: Western blot analyzes the expression of LAP2α in U2OS (left) and SAOS2 (right) cells transiently transfected with control siRNA or LAP2α siRNA for 24 h and then re-expressing doxycycline (DOX)-inducible RNAi-resistant LAP2α for 48 h. Right panel: Quantification of the LAP2α relative protein level in comparison to GAPDH and to siNC was calculated by ImageJ software. Error bars represent the mean ± SEM of four independent experiments. Two-tailed unpaired Student’s t-test was used to calculate p-values. ns, not significant or p ≥ 0.05; *p < 0.05; **p < 0.01. B Representative images show the colocalization of telomere (green, detected by FISH) and PML (red, detected by immunofluorescence) to measure ALT-associated PML bodies (APBs) formation upon LAP2α knockdown in U2OS cells (left panel). Quantification of the average number of APBs in the U2OS cells (right). Error bars represent the mean ± SEM of three independent experiments. Two-tailed unpaired Student’s t-test was used to calculate p-values. ***p < 0.001. C The APBs formation upon LAP2α knockdown in SAOS2 cells (left panel). Quantification of the average number of APBs (right panel). Error bars represent the mean ± SEM of three independent experiments. Two-tailed unpaired Student’s t-test was used to calculate p-values. ***p < 0.001. D C-circle assay in ALT-positive cell lines U2OS cells (left panel). Quantification of the average amount of C-circle (right panel). Error bars represent the mean ± SEM of three independent experiments. Two-tailed unpaired Student’s t-test was used to calculate p-values. **p < 0.01; ***p < 0.001. E C-circle assay in ALT-positive cell lines SAOS2 cells (left panel). Quantification of the average amount of C-circle (right panel). Error bars represent the mean ± SEM of three independent experiments. Two-tailed unpaired Student’s t-test was used to calculate p-values. **p < 0.01; ***p < 0.001. F The colocalization of telomere (red, FISH) and 53BP1 (green, IF) to measure dsDNA breaks at telomere generated by the CRISPR/Cas9 system (left panel). Error bars represent the mean ± SEM of three independent experiments. Two-tailed unpaired Student’s t-test was used to calculate p-values. ***p < 0.001. Quantification of the percentage of cells with TIFs (right panel). G C-circle assay in Hela cells (left panel). Quantification of the average amount of C-circle (right panel). Error bars represent the mean ± SEM of three independent experiments. Two-tailed unpaired Student’s t-test was used to calculate p-values. **p < 0.01; ***p < 0.001.

