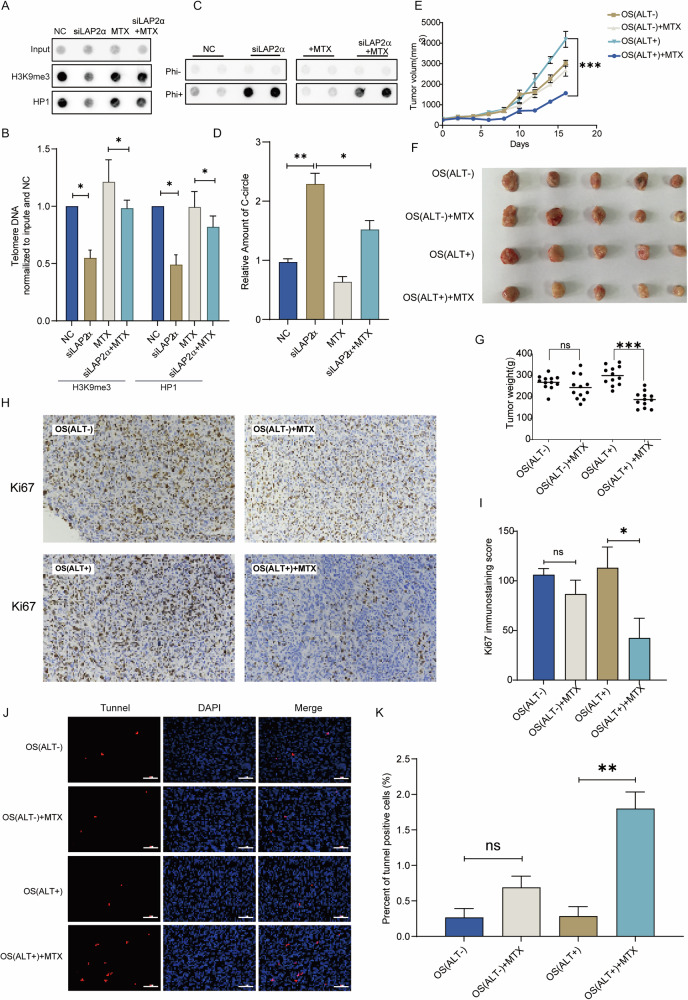
Fig. 7. Methotrexate reverses LAP2α-Induced telomeric chromatin decondensation, offering basis for precise treatment of osteosarcoma.
A U2OS cells were transiently transfected with control siRNA or LAP2α siRNA and/or treated with MTX, cells were harvested and subjected to ChIP experiments using antibodies raised against trimethylated H3K9, HP1 and control IgG binding to telomeres. Telomere repeat DNA was visualized by dot blot and probed with a telomere-specific probe. B Quantification of H3K9me3 and HP1 binding to telomeres. Error bars represent the mean ± SEM of three independent experiments. Two-tailed unpaired Student’s t-test was used to calculate p-values. *p < 0.05. C C-circle assay in U2OS cells treated with LAP2α siRNA and/or MTX. D Quantification of the amount of C-circle in (C). Error bars represent the mean ± SEM of three independent experiments. Two-tailed unpaired Student’s t-test was used to calculate p-values. *p < 0.05; **p < 0.01. E PDX mouse model implanted with a human ALT+ or ALT− osteosarcoma tumor was divided into 4 groups (12 mice per group) and treated with vehicle, 0.5 mg/kg MTX for 2 weeks, Treatment with MTX inhibits ALT+ osteosarcoma PDX tumor size compared with the vehicle group. Error bars represent the mean ± SEM of three independent experiments. Two-tailed unpaired Student’s t-test was used to calculate p-values. ***p < 0.001. F ALT+ PDX tumor morphology decreased after treatment with MTX compared to the control group. MTX did not significantly affect ALT− PDX tumor morphology compared with the vehicle group. G The graph of PDX tumor weight: ALT+ PDX tumor weight in the group treated with MTX was lower than the other groups. Error bars represent the mean ± SEM of three independent experiments. Two-tailed unpaired Student’s t-test was used to calculate p-values. ns, not significant; ***p < 0.001. H Representative images of immunohistochemistry (IHC) staining for Ki67 (×20). I The analysis of Ki67 positive cells. J The representative Tunnel (red) and DAPI (blue) staining (×20) results of tumor tissues from PDX-model mouse in different groups after MTX treatment. K The relative Tunnel positive rates (%) in different groups. Note: Two-tailed unpaired Student’s t-test was used to calculate p-values. ns, not significant; **p < 0.01.

