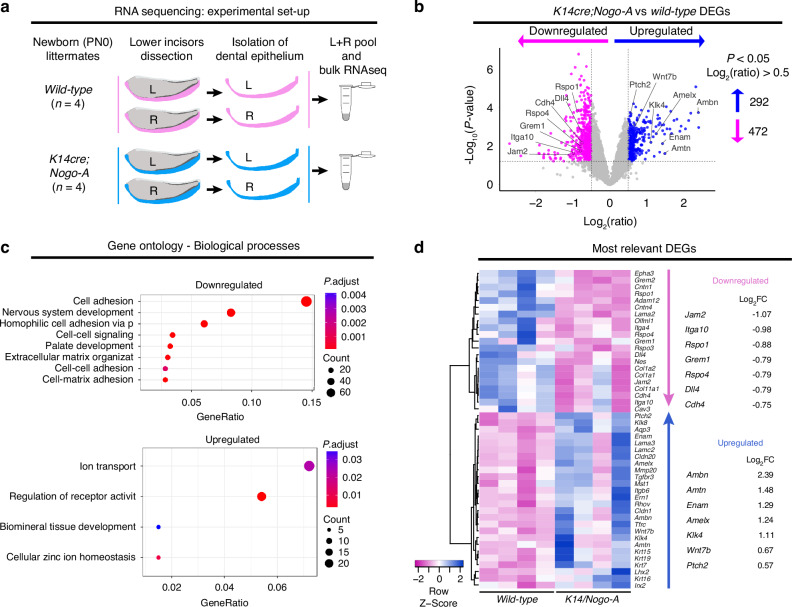
Fig. 4.
Nogo-A regulates the expression of gene clusters. a Experimental strategy. n = 4 K14;Nogo-A and n = 4 wild-type (control) new-born pups were analysed. The dental epithelia isolated from the left and right lower incisors of each pup were pooled and processed as one replicate. b Volcano plot showing significantly downregulated (red arrow) and upregulated (green arrow) genes in K14;Nogo-A dental epithelium. The thresholds were P < 0.05 and log2 (ratio) > 0.5. c Gene ontology analysis showing the biological processes significantly upregulated (up) and downregulated (down). d Heatmap showing selected differentially expressed genes (DEGs). Values on the right report the log2FC (K14cre;Nogo-A / wild-type) for selected genes

