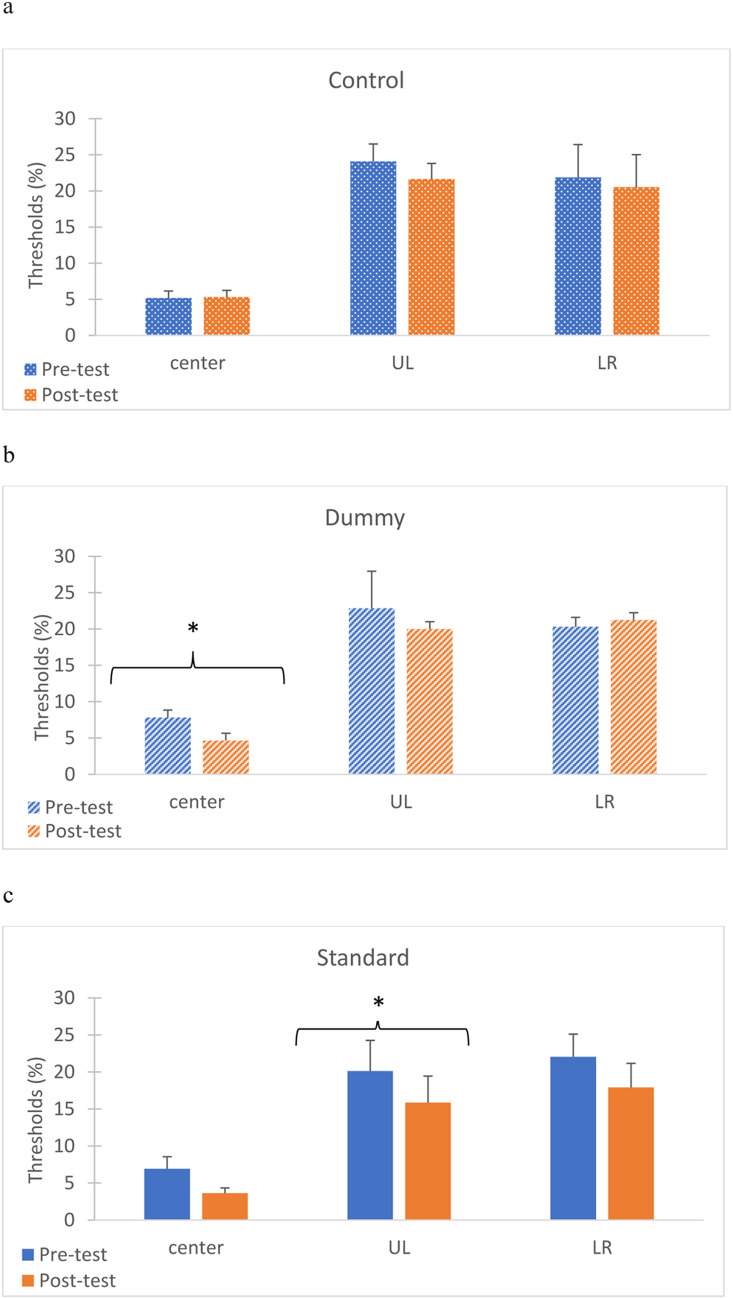
Figure 6.
Comparison of the contrast detection thresholds at three different locations: center, Upper Left (UL), at the texture target location, and Lower Right (LR) in three different TDT training groups: (a) Control, no TDT, group (n = 6), (b) Dummy TDT (reduced-adaptation) group (n = 5), and (c) Standard TDT (adaptation) group (n = 6). Shown are detection thresholds (% contrast) pre-test (blue bars) and post-test (orange bars) training without TDT training (a), and with TDT (b, c). One asterisk denotes the significance (p < 0.05) of the average improvement in the pre- and post-test after dummy training at the center location, and after standard training at the UL location. Error bars represent the standard error.

