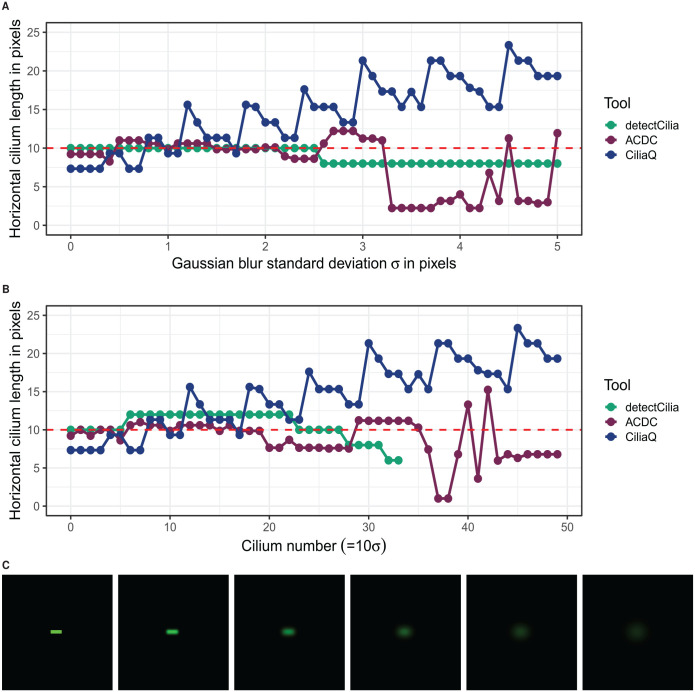
Figure 3.
Simulated cilia with a length of 10 pixels and a width and height of 3 pixels with added Gaussian blur were measured by all 3 tools. (A) and (B) show the results of the horizontal length measurements. In (A), the cilia with added Gaussian blur were detected and measured individually (1 cilium per image). In (B), the images with the blurred cilia were combined; therefore, one image containing all cilia (except for the cilium with an added blur of σ = 5 pixels) was used for detection and measurement. (The cilium number divided by 10 corresponds to the Gaussian blur standard deviation in pixels used for that particular cilium.) The results of CiliaQ are identical for both approaches. (C) Images of the z-stack projection of the simulated cilium with Gaussian blur standard deviation values and 5 pixels (from left to right).

