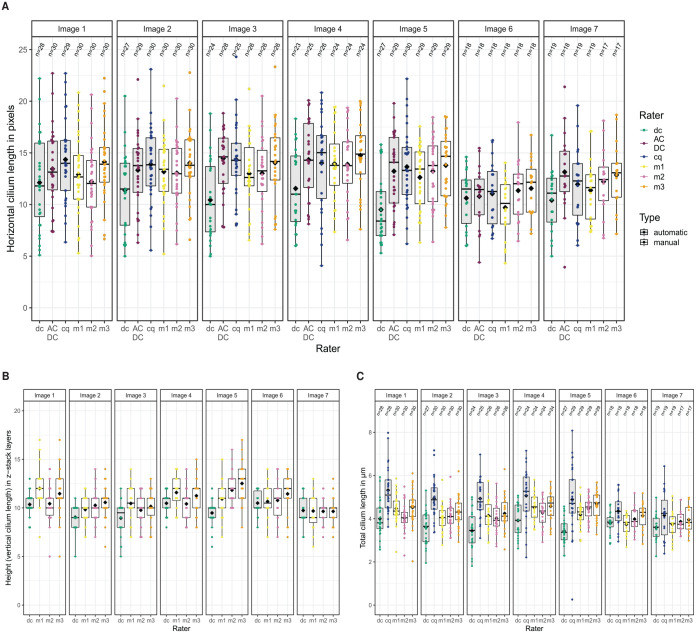
Figure 4.
Results of automatic and manual detection and measurement of cilia in the 7 test images from the ITS with Dexa group. (A) Horizontal length (in pixels) measured in z-stack projection by all 3 tools and 3 raters. (The size of one pixel in -direction and -direction is 0.2196 µm). (B) Vertical length (in z-stack layers) determined by the distance from the lowest to the highest z-stack layer containing pixels belonging to a specific cilium. (The z-step interval is 0.2814 µm.) (C) Total length (in µm) of every cilium in every image. Note that CiliaQ used the z-stack projection images for horizontal length measurements and the original CZI files for the total lengths, resulting in slightly different numbers of detected cilia. All box-and-whisker plots are shown with median, first and third quartiles, outliers, as well as the mean values (black diamonds).
cq indicates CiliaQ; dc, detectCilia; m1 to m3, 3 independent manual raters.

