Fig. 1.
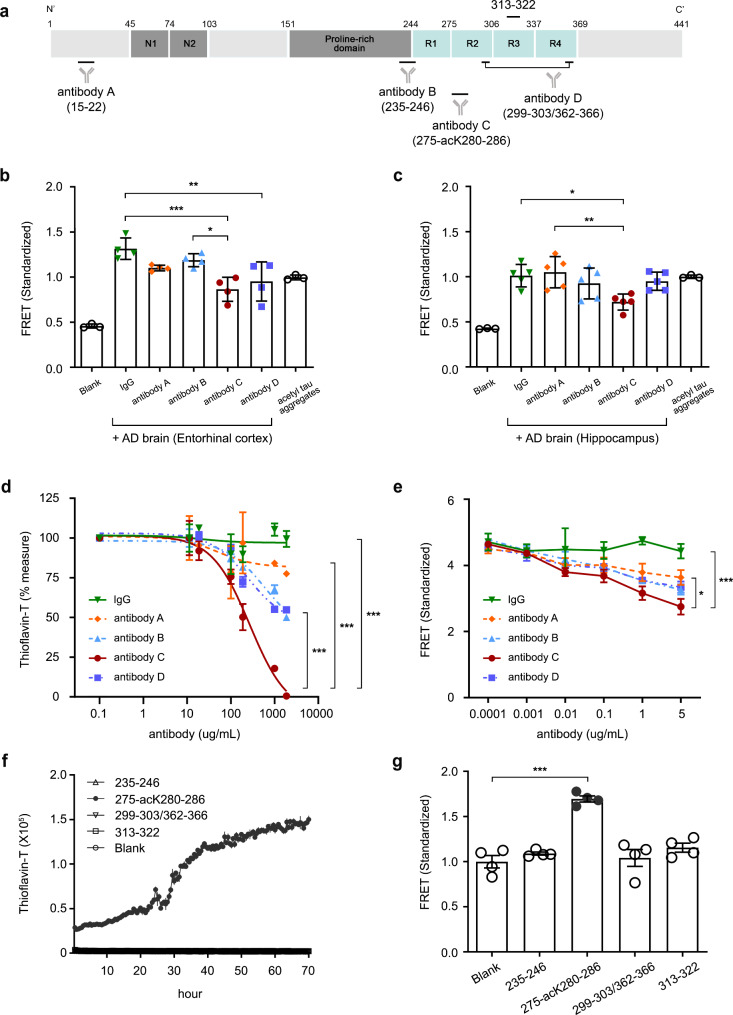
a A schematic domain map of tau 2N4R isoform and target epitopes of various anti-tau antibodies and epitope peptides. Relative location on the tau isoform of antibodies’ epitope sequences is represented by the antibody’s name and amino acid residue numbers within brackets
b, c FRET signal of human Alzheimer’s disease insoluble tau fraction extract co-incubated with various anti-tau antibodies (1 µg/mL) at endpoint. Tau-FRET cells were treated with entorhinal cortical (n = 4) (b) or hippocampal (n = 5) (c) extract from Alzheimer’s disease patients and various anti-tau antibodies
d ThT signal of acetylated tau aggregates co-incubated with various anti-tau antibodies at endpoint. Acetylated tau aggregates were incubated with ThT fluorescent dyes (1:1 ratio) and anti-tau antibodies at various concentrations for 70 h
e FRET signal of acetylated tau aggregates co-incubated with various anti-tau antibodies at endpoint. Tau-FRET cells were treated with acetylated tau aggregates and anti-tau antibodies at various concentrations
f ThT fluorescence signal of peptides corresponding to target epitope sequences of anti-tau antibodies. Each peptide was incubated with ThT fluorescent dyes (1:1 ratio)
g FRET signal of peptides corresponding to target epitope sequences of anti-tau antibodies. Tau-FRET cells were treated with peptides corresponding to target epitope sequences of anti-tau antibodies at endpoint
Two-way ANOVAs (d, e) and one-way ANOVAs were used for statistical analysis followed by Tukey’s multiple comparisons test. Line graphs present the mean ± SE determined from independent experiments represented by dots, each performed in triplicate. *p < 0.05, **p < 0.01, ***p < 0.001

