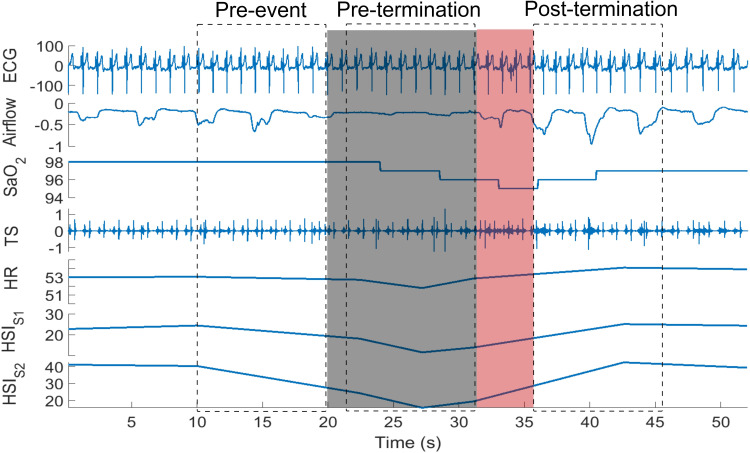
Figure 2.
An extracted hypopnea and the segments of the data considered for heart rate and HSI analysis. The gray shaded area shows hypopnea and the red shaded area indicates the arousal. The dotted rectangles represent the 10-second pre-event, pre-termination and post-termination segments considered for our analysis.
Abbreviations: ECG, electrocardiogram (mV); SaO2, oxygen saturation (%); TS, tracheal sound; HR, heart rate (bpm); HSIS1, S1 intensity (db); HSIS2, S2 intensity (db).

