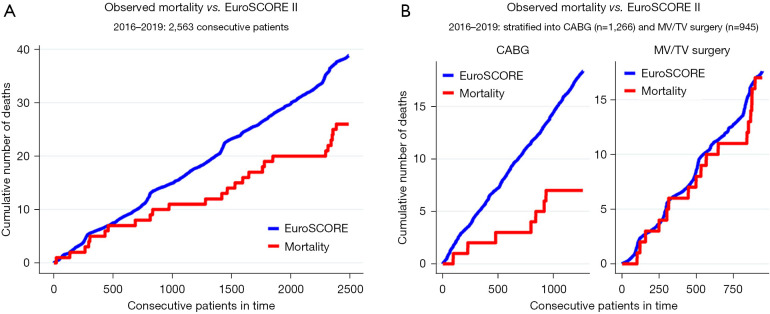
Figure 5.
Cited from Cerny et al. (5). Cumulative incidence curve of observed mortality vs. expected mortality according to EuroSCORE II for (A) all consecutive patients and (B) stratified for CABG and MV/TV surgery. The x-axis represents all consecutive patients operated between 2016–2019. The red line represents the cumulative number of deaths as observed in this cohort of patients undergoing robotic cardiac surgery (“observed mortality”) while the blue line represents the cumulative sum of mortality risk as predicted based on the same patient’s baseline demographical characteristics using the EuroSCORE II as if they had undergone conventional surgery (“expected mortality”). The observed mortality was lower than that expected according to EuroSCORE II in the overall sample, mainly driven by a reduction in the mortality after CABG. CABG, coronary artery bypass grafting; MV, mitral valve; TV, tricuspid valve.

