
Fig. 2.
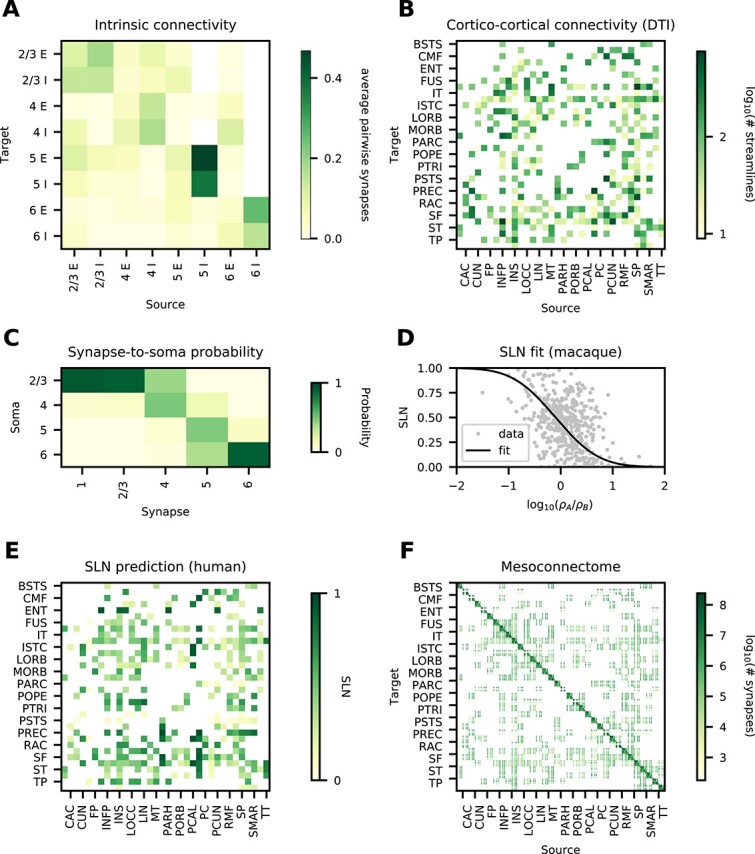
Data and predictive connectomics. (A) Within-area connectivity blueprint (average number of synapses per pair of neurons). (B) Inter-areal connectivity based on DTI (number of streamlines); see Table 1 for acronyms. (C) Probability for inter-areal synapses in a given layer to be established on neurons with cell body in a given layer, estimated from human neuron morphologies. (D) Relation of neuron densities of source area B and target area A with laminar source pattern (fraction of supragranular labeled neurons,  ) in macaque. (E) Predicted source pattern (
 ) in human. (F) Layer- and population-resolved mesoconnectome (number of synapses).