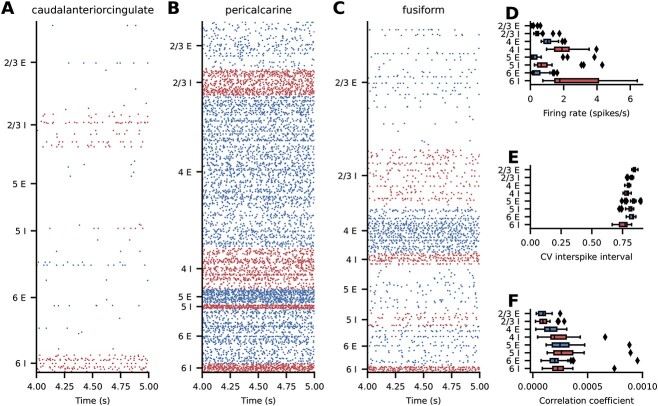
Fig. 4.
Spiking activity in the base version of the model. (A–C) Raster plots for 3 representative areas; subsampled to  of the excitatory (blue) and inhibitory (red) neurons. (D–F) Layer- and population-resolved distribution of population-averaged statistics across areas; boxes show quartiles, whiskers are within
  times the interquartile range, symbols show outliers outside of the whiskers. (D) Firing rate. (E) CV ISI of neurons with at least
  spikes. (F) Pairwise correlation coefficient of a random subsample of
  neurons for each population.

