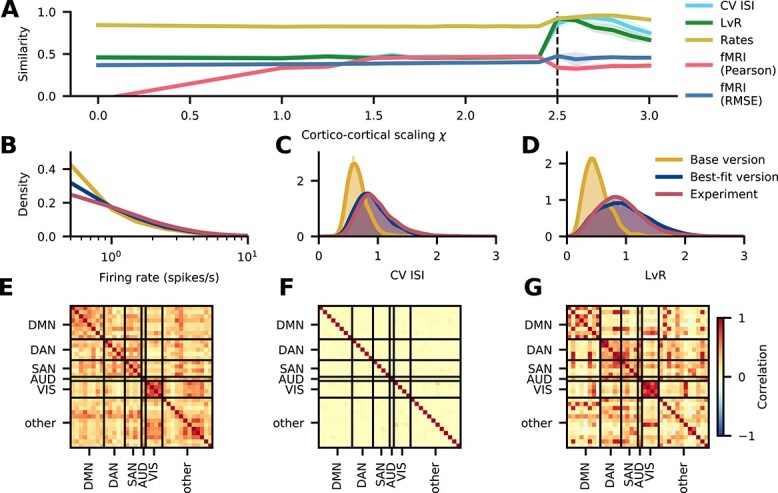
Fig. 5.

Comparison with experimental activity data. (A) Similarity of simulated spiking activity in area caudalanteriorcingulate to experimental spiking data (Minxha et al. 2020) recorded in medial frontal cortex and to resting-state fMRI functional connectivity (cf. Sec. “FMRI data”) as a function of the scaling parameter  for inter-areal synaptic strengths. The vertical dashed line at
  corresponds to the chosen best-fitting version. The shaded areas represent the standard deviation over
  simulation runs, each with a different random seed. (B–D) Distribution of spiking statistics across neurons in experimental spiking data (Minxha et al. 2020) and in the simulated base and best-fitting versions: distribution of firing rates (B), CV ISI (C), and revised local variation (LvR; Shinomoto et al. 2009) (D). (E–G) Functional connectivity in the default mode network, DAN, SAN, auditory network (AUD), visual network (VIS), and the remaining areas (other). Experimental functional connectivity of the right hemisphere from fMRI recordings, averaged across 19 subjects (E). Simulated functional connectivity based on synaptic input currents in the base (F) and the best-fitting version (G).
