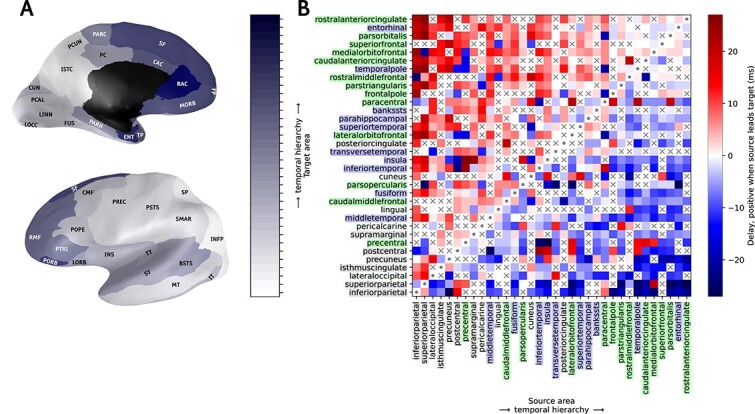
Fig. 7.

Temporal hierarchy of activity flow across the network. Inflated medial and lateral views of the brain (A) depict the temporal order of activation, with colors ranging from white for the most leading area to dark blue for the last. The black zone in the medial view is not part of the model. The temporal hierarchy matrix in (B) is based on the estimation of delays obtained as peaks in the cross-correlation function between source and target area, with the ordering of areas determined as described in the section “Temporal Hierarchy from Model Spiking Data”. The matrix is symmetric across the diagonal with inverse sign. Cells marked with “x” indicate delays classified as ‘undecided’. On the x- and y-axis the brain area labels are colored according to a coarse anatomical division of parietal (gray), occipital (light gray), temporal (blue) and frontal (green) lobes. Abbreviations from Table 1. Brain meshes from Winkler (2013); Bakker et al. (2015).
