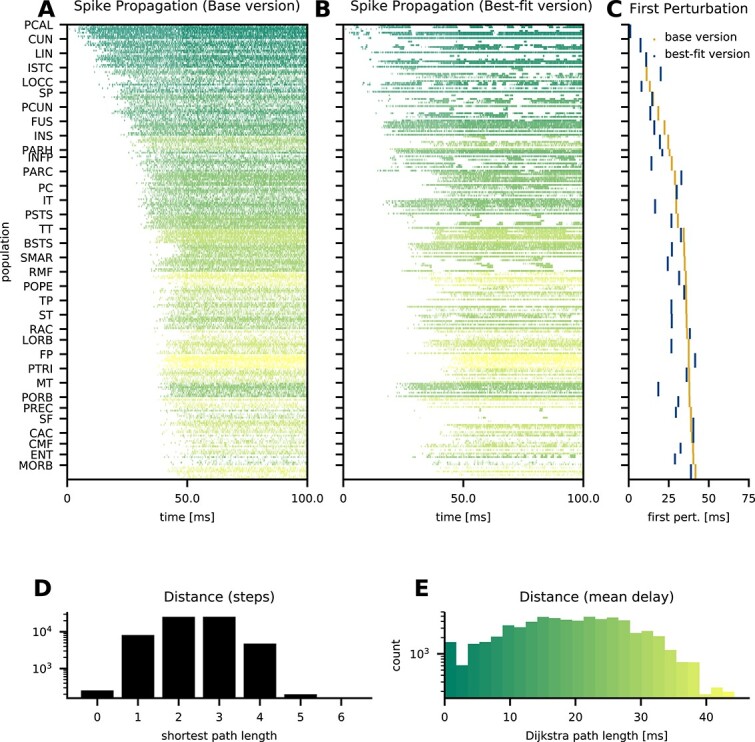
Fig. 8.

Propagation of the effects of a single spike. Binary absolute difference of spike counts per population in  bins between a perturbed and an unperturbed simulation with identical parameters and random seeds in the base version (A) and the best-fit version (B); the color quantifies the Dijkstra path length between the perturbed and the target population. Populations are ordered corresponding to the previous figures; for the scale see panel E. Timing of the first spike count difference per area (C) in the base version (orange) and the best-fit version (blue). Histogram of shortest path lengths between all pairs of populations in the network (D). Histogram of shortest path lengths weighted by the average delay between all pairs of populations in the network (E).
