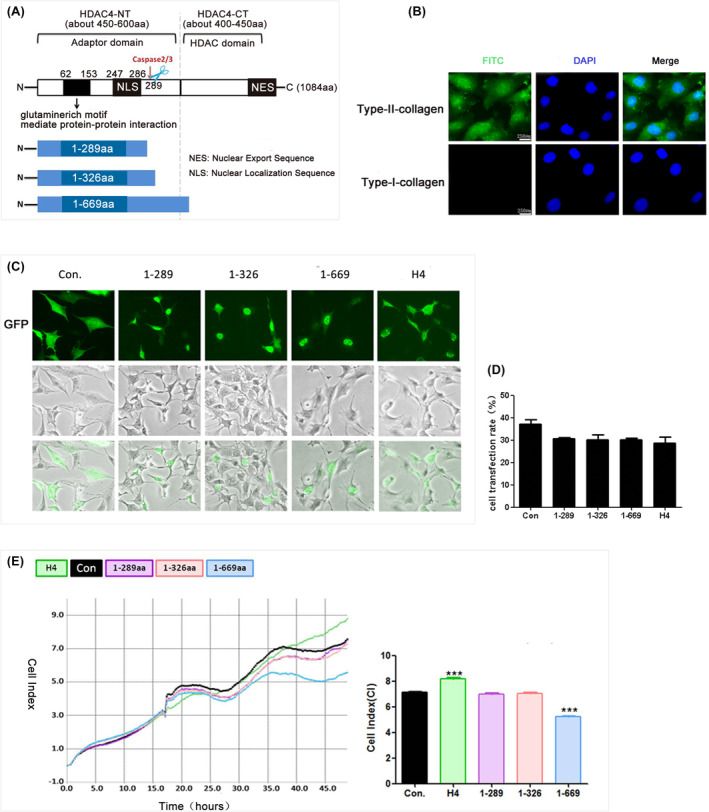
FIGURE 1.

The HDAC4‐NT fragment (1‐669aa) induced chondrocytes death. (A) A schematic diagram of HDAC4 protein and HDAC4‐NT fragment. (B) Immunofluorescence assay results showed that cells were positive for type II collagen (green) and negative for type I collagen (green, scale bar: 250 μm). (C) The transfection efficiency in each group was observed by fluorescence microscopy. The EP, HDAC4‐NT fragments and full‐length HDAC4 carried GFP; green; scale bar: 50 μm. (D) The percentage of GFP‐positive cells in all cells with green fluorescence were quantified (n = 3). (E) Representative cell survival rates of groups were detected by RTCA assay, the data were quantified by average cell index (CI), ***p < 0.001. (n = 3).
