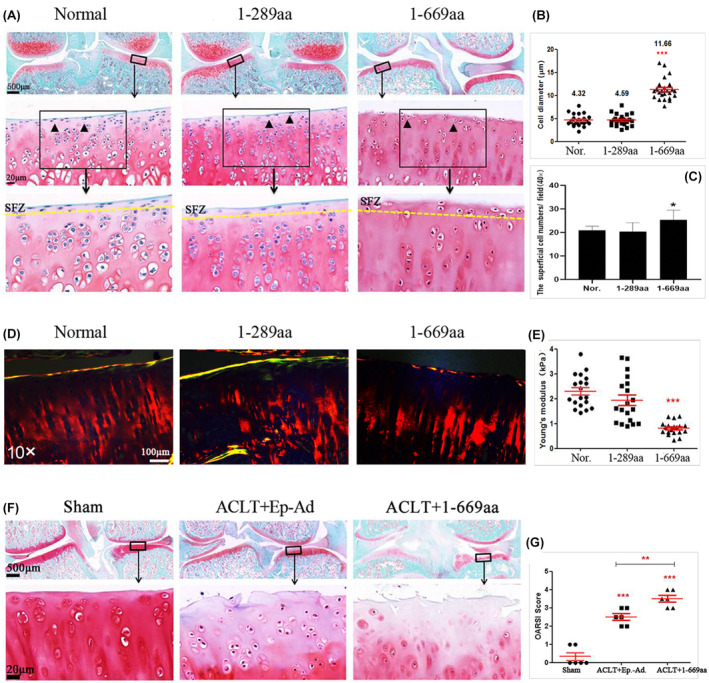
FIGURE 2.

Intra‐articular HDAC4‐NT fragments (1‐669aa) injection induced the articular cartilage injury. (A) Safranin O and fast green staining results of normal, 1‐289aa and 1‐669aa treatment groups showed the degenerative degree of cartilage tissue, the figures in the first line (2×; scale bar: 500 μm), the figures in the second line (40×; scale bar: 20 μm), SFZ: The superficial zone. (B) the data were quantified by average diameter of the chondrocytes in the superficial zone, p < 0.001. (n = 24). (C) the data were quantified by average number of the chondrocytes in the superficial zone, p < 0.05 (n‐6). (D) Representative Sirius Red staining results. (10×; scale bar: 100 μm). (E) Average Young's modulus of groups was quantified (n = 6). (F) Representative Safranin O and fast green staining results of sham, ACLT+Ep.‐Ad. and ACLT+1‐669aa treatment groups, the figures in the first line (2×; scale bar: 500 μm), the figures in the second line (40×; scale bar: 20 μm). (G) the data were quantified by average OARIS scores of each group, **p < 0.01, ***p < 0.001. (n = 6).
