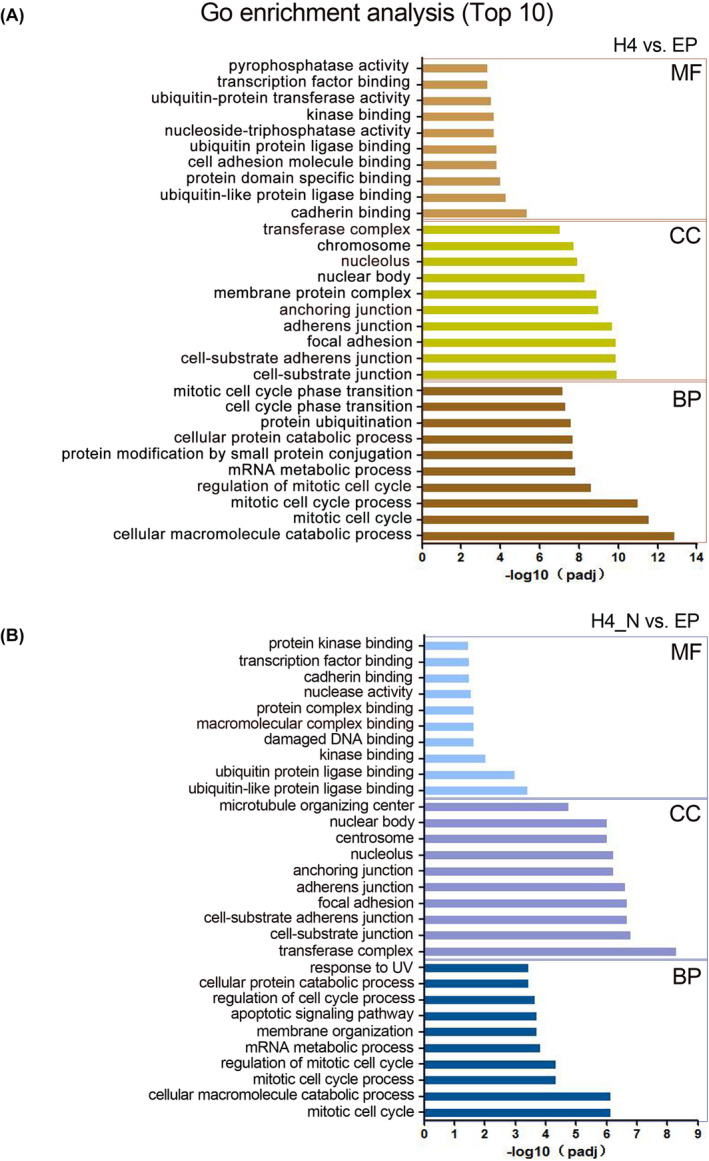
FIGURE 3.

Gene Ontology (GO) functional enrichment analysis of DEGs for different treatment groups (H4 vs. EP and H4_N vs. EP). The terms with red lines below were mainly associated with the GO analysis of H4_N versus EP. BP, biological process; CC, cell component; EP, empty plasmid; H4, HDAC4; H4_N, HDAC4‐NT fragment 1‐669aa; MF, molecular function. A, the GO functional enrichment analysis of DEGs for H4 vs. EP; B, the GO functional enrichment analysis of DEGs for H4_N vs. EP.
