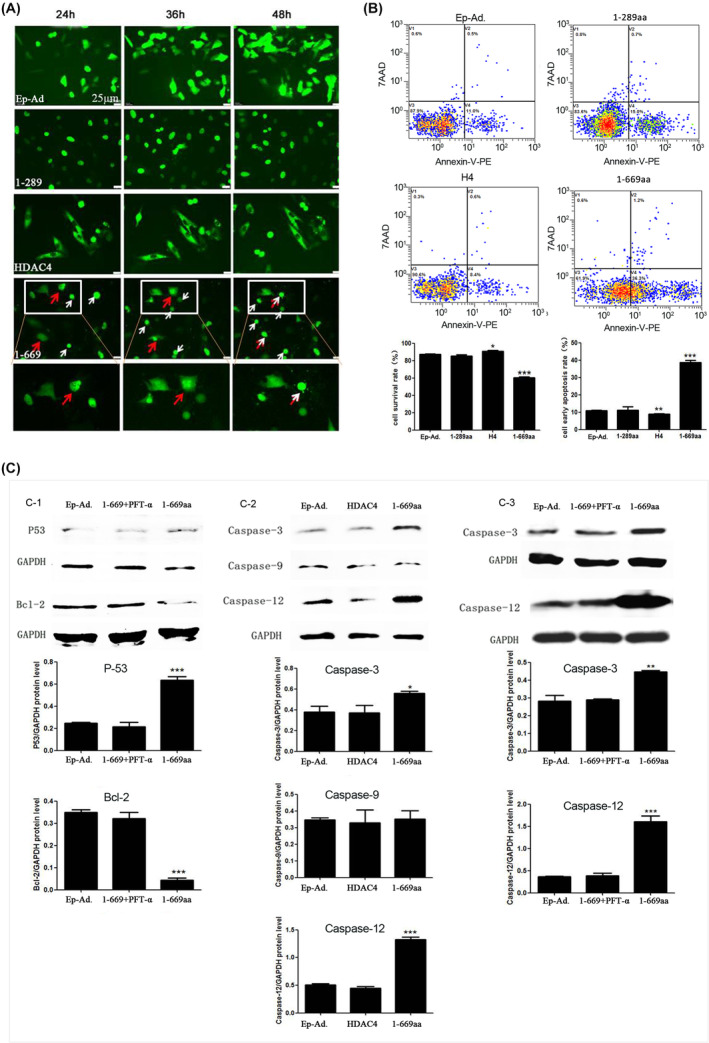
FIGURE 5.

In vitro validation of the RNA‐seq. results. (A) Representative confocal microscopy images of different transfection groups (Ep.‐Ad., 1‐289aa, H4 and 1‐669aa) from 24 to 48 h after transfection, (Scale bar = 25 μm), white arrows showed the floating dead cells, red arrows showed the obvious nuclear cleavage. (B) Cell viability was detected by flow cytometry, and the data were quantified by the survival rate and the early apoptosis rate (n = 6). (C) Validation of p53, Bcl‐2, caspase‐3, caspase‐9 and caspase 12 expression by Western blotting (n = 3). Data are expressed as the mean ± SD, *p < 0.05; **p < 0.01, ***p < 0.001.
