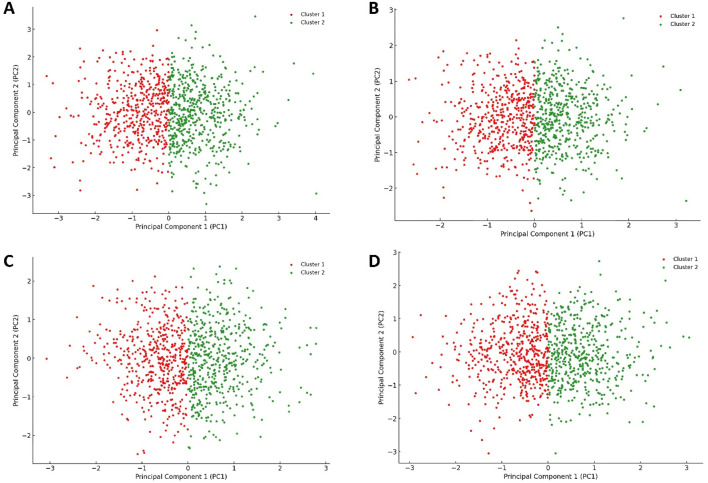
FIGURE 10.
Projections of human Pim-1 kinase trajectories on the first two PCA eigenvectors of the MD trajectories. (A) represents the PCA plot of the unliganded Pim-1 kinase; (B) represents the PCA plot of Pim-1 kinase bound to quercetin; (C) represents the PCA plot of Pim-1 kinase bound to galangin; (D) represents the PCA plot of Pim-1 kinase bound to kaempferol. These bound compounds represent the flavonoids that potently inhabited Pim-1 kinase.

