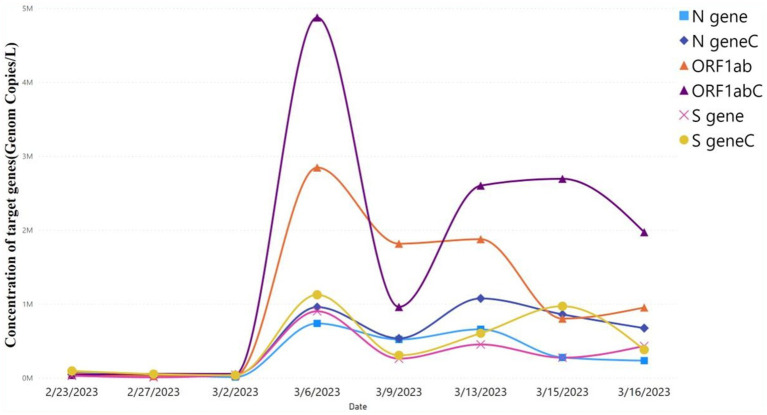
Figure 2.
Viral concentration of autosampler and Moore swab sampling technique. Comparison of viral target genes concentration level using autosampler vs. Moore swab sampling technique. ORF1ab, N gene, and S gene were the target genes. Target genes with “C” represent the concentration of viral target genes using the autosampler, whereas target genes without “C” represent the viral target concentration using the Moore swab sampling technique. The level of concentration of the target genes predicted by the autosampler vs. swab sampling technique was not significant (p > 0.05).

