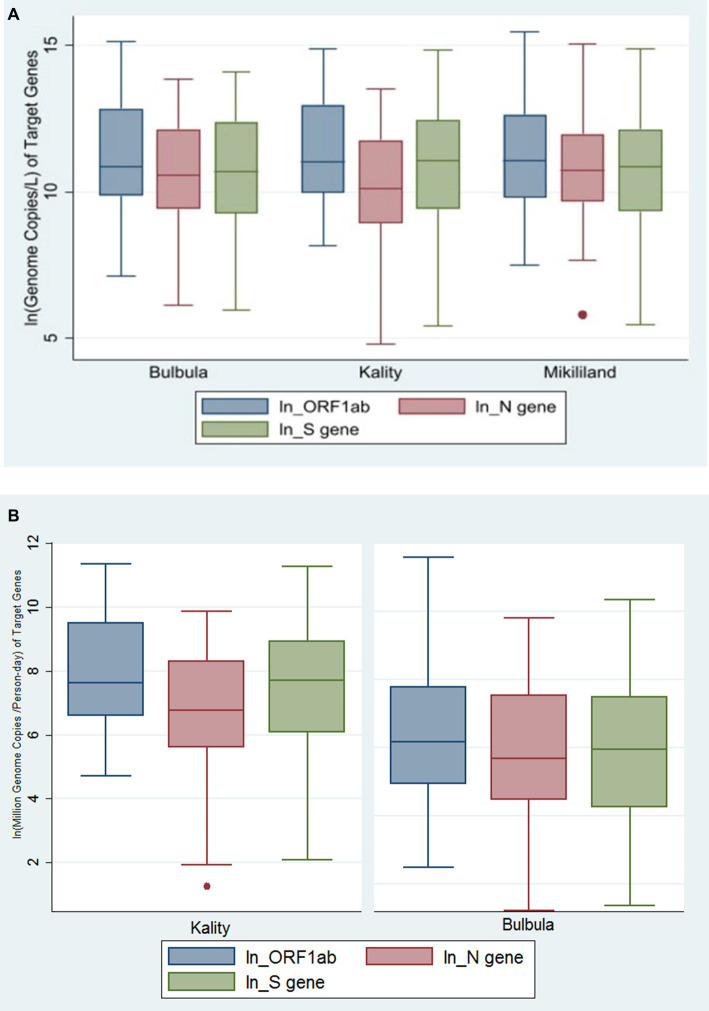
Figure 3.
(A) Genome copies per L of SARS-CoV-2 gene targets in three wastewater treatment plants using Box–Whiskers plot. The data represents the average number of SARS-CoV-2 gene copies for ORF-1ab gene, N gene, and S gene per L of wastewater sample obtained in the influent wastewater samples from the Three WWTPs. (B) The viral concentration of daily load per person in sewershed (MGC per Person-day) of SARS-CoV-2 gene targets in two wastewater treatment plants using Box–Whiskers plot.

