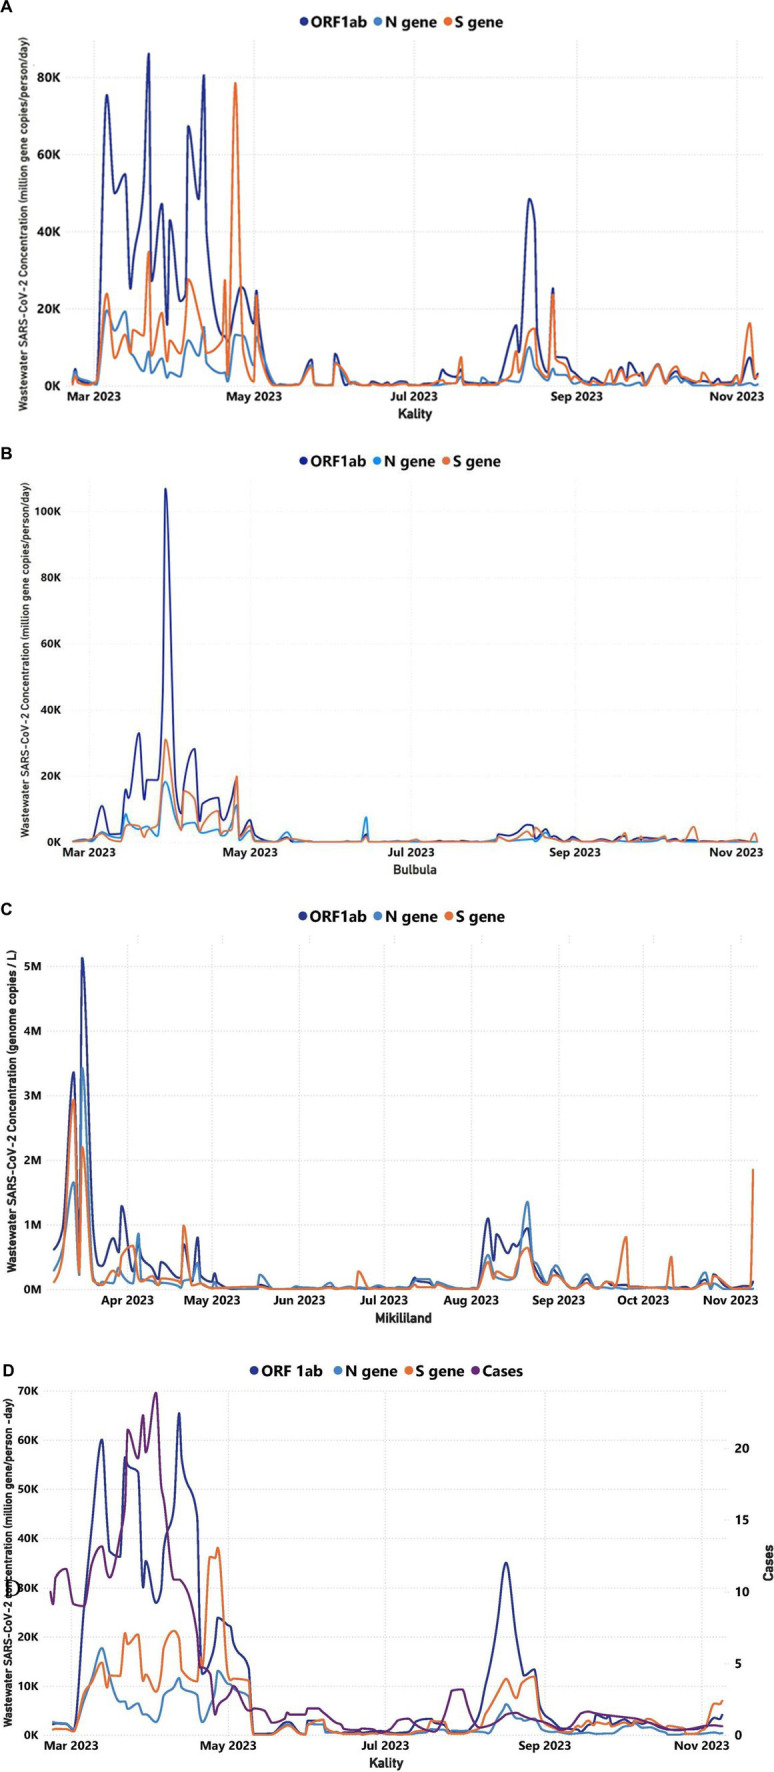
Figure 5.

Trends in the viral target genes concentration of wastewater over time for three WWTPs in Addis Ababa (February 22, 2023–November 9, 2023): (A) Trends in the viral target genes concentration of wastewater over time for KTP, (B) Trends in the viral target genes concentration of wastewater over time for Bulbula WWTP, (C) Trends in the viral concentration of wastewater over time for Mikililand WSP, and (D) A comparison between the COVID-19 cases illustrated in purple color line that were reported in Addis Ababa and the SARS-CoV-2 target genes concentrations in KTP. The y-axis on the left represented the MGC/person-day of the target genes, whereas the y-axis on the right represented the number of reported cases. The correlation between the trend of daily reported cases and RNA concentration was significant (p < 0.05) in Kality. The number of cases and average SARS-CoV-2 concentration is based on the 7-day rolling average.
