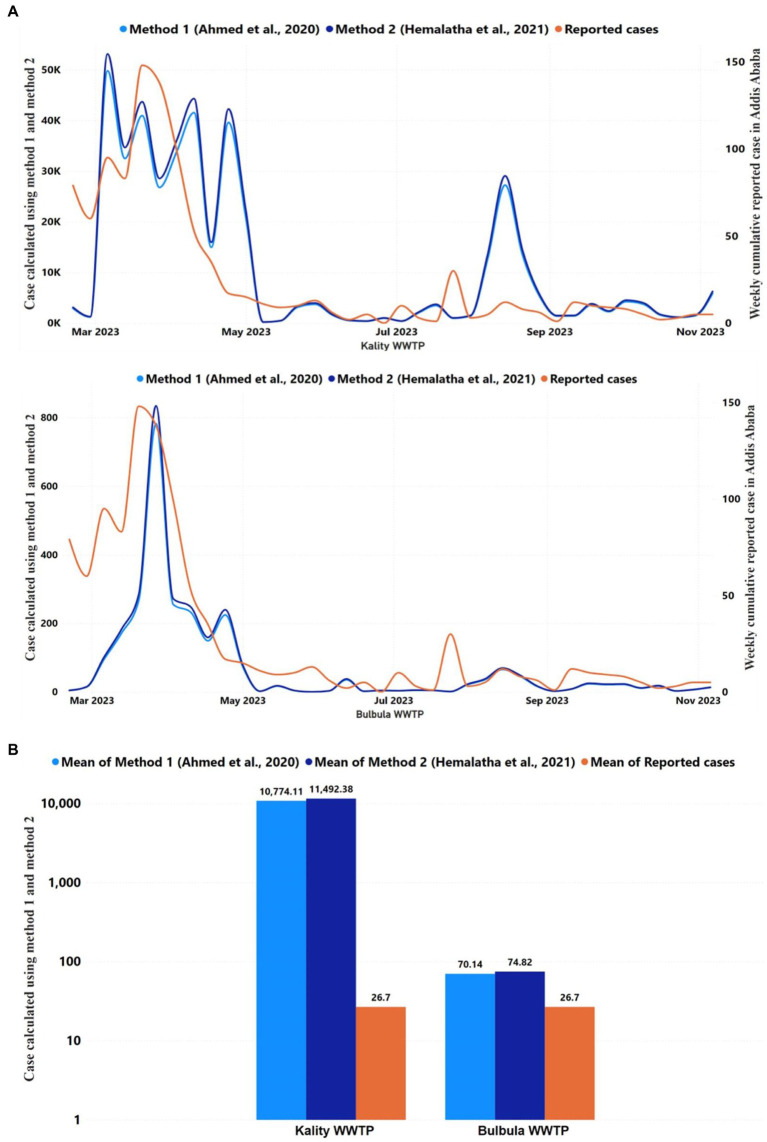
Figure 6.
Reported and predicted COVID-19 infected cases across 2 WWTPs, (A) Trends in the COVID-19 reported cases and daily average predicted infected individuals using Ahmed et al. (27) and Hemalatha et al. (46) methods in Kality and Bulbula WWTP. The y-axis on the left represented the number of predicted cases using two methods, whereas the y-axis on the right represented the number of reported cases. The correlation between the trend of cumulative weekly reported and daily predicted COVID-19 cases was significant (p < 0.05) among the two WWTPs. (B) The figure represents the mean of COVID-19 reported cases of each WWTP during the study period and the predicted infected individuals using the Ahmed et al. (27) and Hemalatha et al. (46) methods for each WWTP for the study period.

