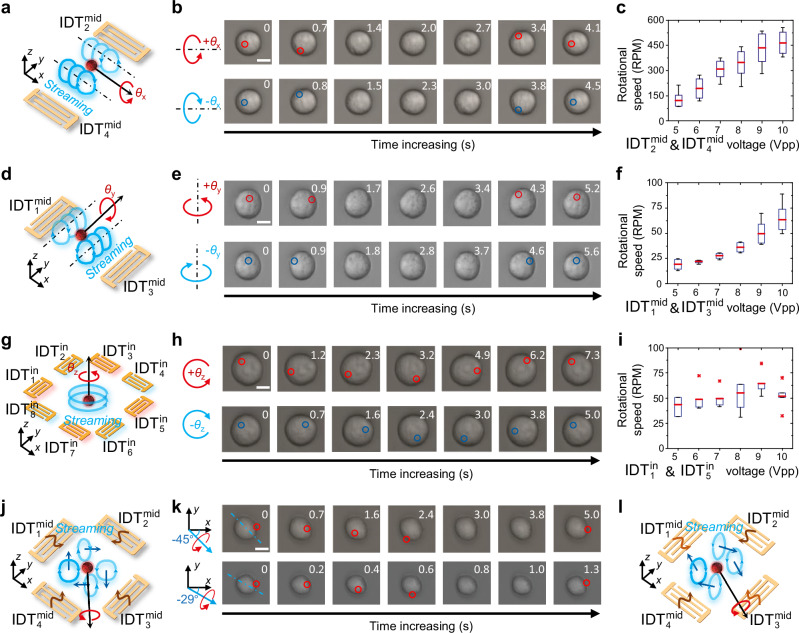
Fig. 3. 3D rotations of an acoustically trapped MCF7 cell.
a Schematic of a cell rotating in the θx-direction driven by acoustic streaming generated by and . b Sequential images showing an MCF7 cell rotated in the + θx-direction when <(top row) and – θx-direction when . Scale bar: 10 μm. c Analysis results of rotated cells (Doing N repeated tests with different cells: N = 4) showing the cell rotation speed in the + θx-direction gradually increases with the input voltage increase. d Schematic of a cell rotating in the θy-direction driven by acoustic streaming generated by and . e Sequential images showing an MCF7 cell spined in the + θy- (top row) and – θy- (bottom row) directions. Scale bar: 10 μm. f Analysis results of rotated cells (Doing N repeated tests with different cells: N = 4) showing the cell rotation speed in the + θy-direction gradually increases with the input voltage increase. g Schematic of a cell rotating in the θz-direction driven by acoustic streaming generated by to h Sequential images showing an MCF7 cell rotated in the + θz-direction when activating and as well as – θz-direction when activating and . Scale bar: 10 μm. (i) Analysis results of cell rotation speeds (Doing N repeated tests with different cells: N ≥ 3) in the + θz-direction at different excitation voltages. j Schematic illustrating the mechanism to induce cell rotation carrying an angular momentum in − 45° in the x-y plane. k Sequential images showing an MCF7 cell rotated with respect to axes of − 45° (top) and − 29° (bottom) in the x-y plane. Scale bar: 10 μm. l Schematic illustrating the mechanism to induce cell rotation carrying an angular momentum in − 30° in the x-y plane. In (c, f, and i), each box plot displays statistical measures: the central red line indicates the average value, and the bottom and top of the box represent the 25th and 75th percentiles, respectively. Whiskers extend to the lowest datum within 1.5 times the interquartile range (IQR) from the 25 th percentile and the highest datum within 1.5 times the IQR from the 75 th percentile. Outliers are donated by asterisks.

