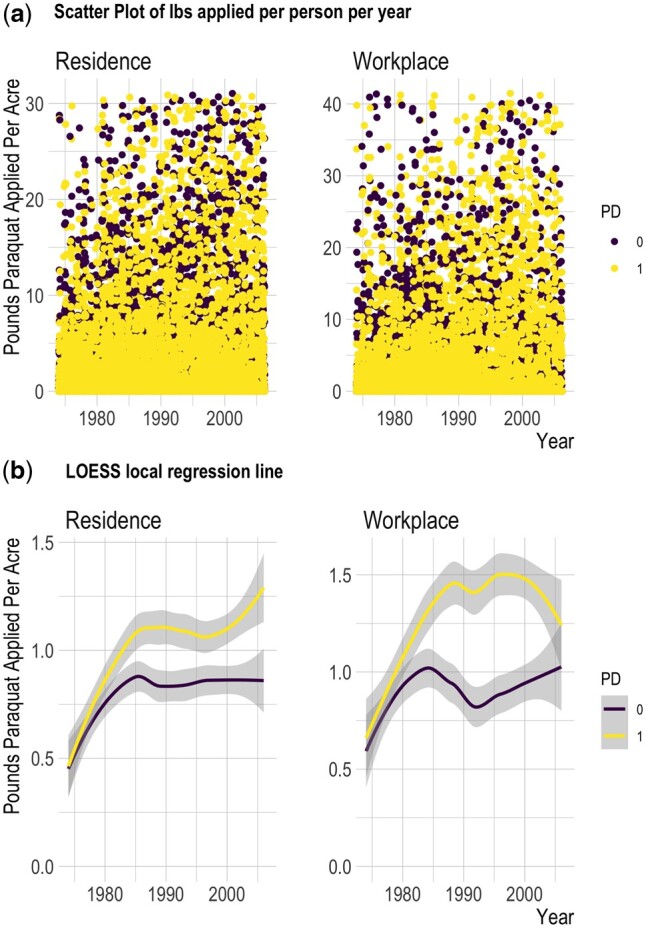
Figure 2.

Pounds of agriculturally applied paraquat active ingredient per acre, per subject 1974–2007. (a) Scatter plot of pounds active ingredient applied per acre for each participant each year within 500 m of residential address and workplace address. (b) Smoothed trend line from loess local regression based on data shown in plots above. Lb, pounds; LOESS, locally estimated scatterplot smoothing
